
 US Personal Income and Outlays
- Source
- Bureau of Economic Analysis
- Source Link
- https://www.bea.gov/
- Frequency
- Monthly
- Next Release(s)
- April 9th, 2026 8:30 AM
-
April 30th, 2026 8:30 AM
-
May 28th, 2026 8:30 AM
-
June 25th, 2026 8:30 AM
-
July 30th, 2026 8:30 AM
-
August 26th, 2026 8:30 AM
-
September 30th, 2026 8:30 AM
-
October 29th, 2026 8:30 AM
-
November 25th, 2026 8:30 AM
-
December 23rd, 2026 8:30 AM
Latest Updates
-
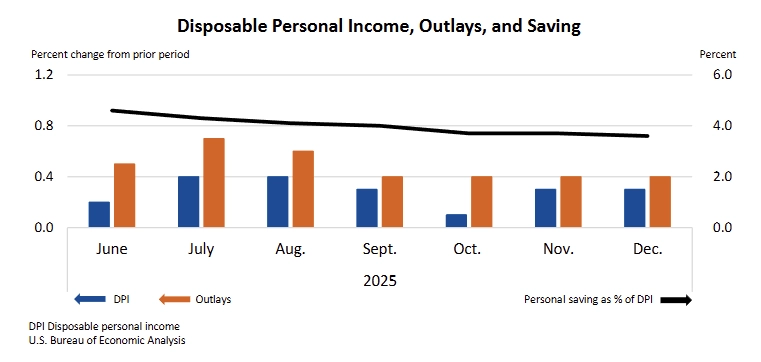
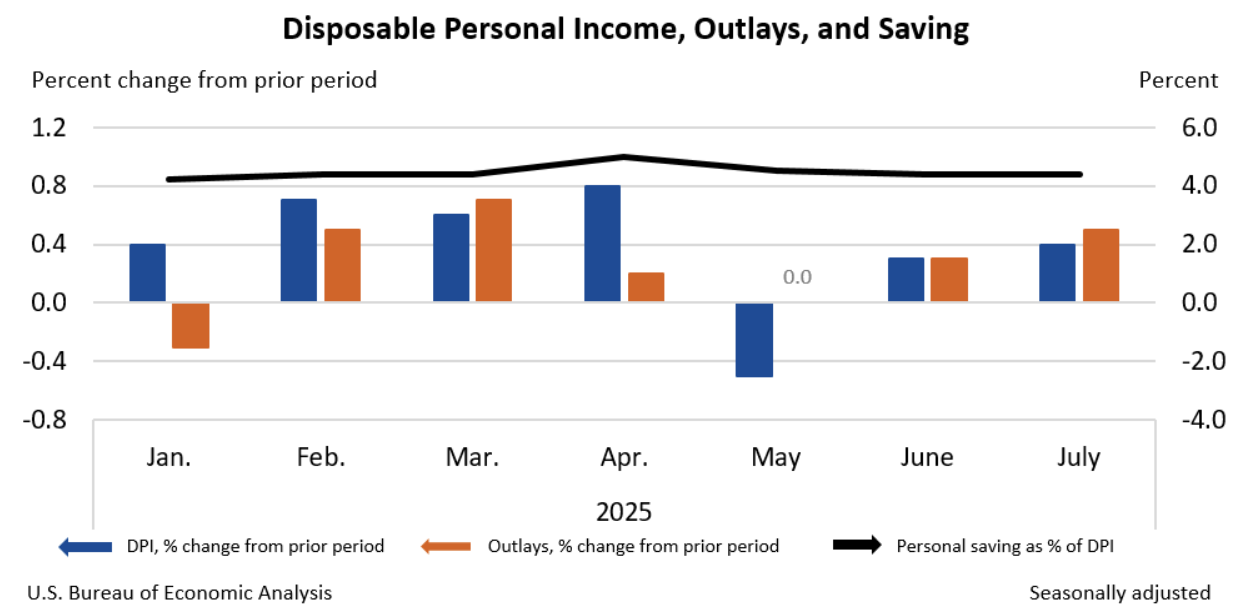
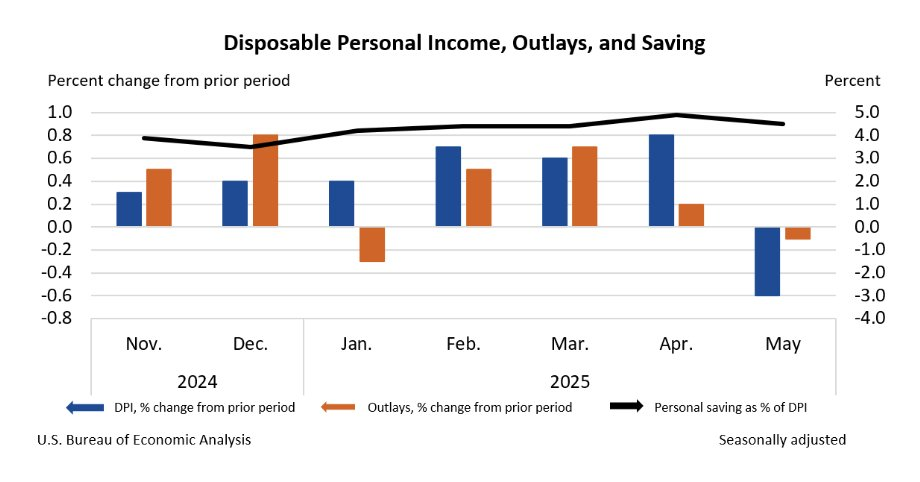
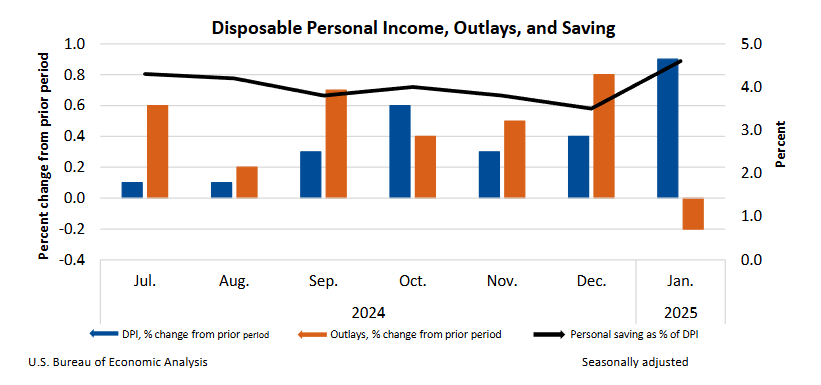
Personal income rose +0.3% MoM and spending +0.4% MoM in December, while PCE inflation accelerated to +2.9% YoY, showing firmer price pressures late-year.
-
Disposable income also increased +0.3% MoM, but employee compensation rose only +0.2% MoM, the weakest since June, indicating income growth relied partly on transfer receipts (about 45% of growth).
-
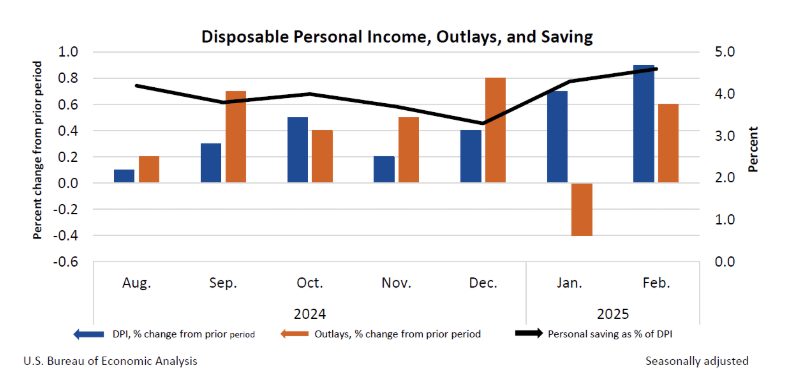
Personal consumption outpaced income for the eighth consecutive month, pushing the savings rate down to 3.6% (lowest since 2022), showing continued drawdown of savings.
-
Services spending rose +0.7% MoM while goods spending fell -0.1% MoM, meaning consumption growth remained concentrated in services.
-
Real PCE increased only +0.1% MoM, while the PCE price index rose +0.4% MoM (core +0.4% MoM), indicating nominal spending gains were largely price-driven.
-
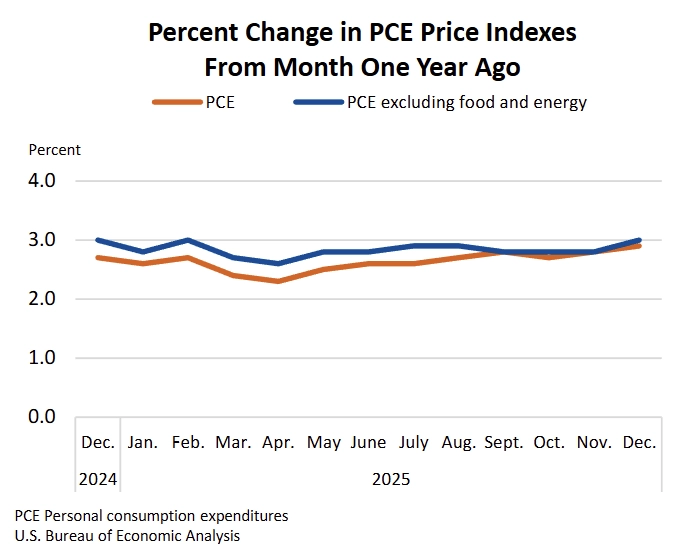
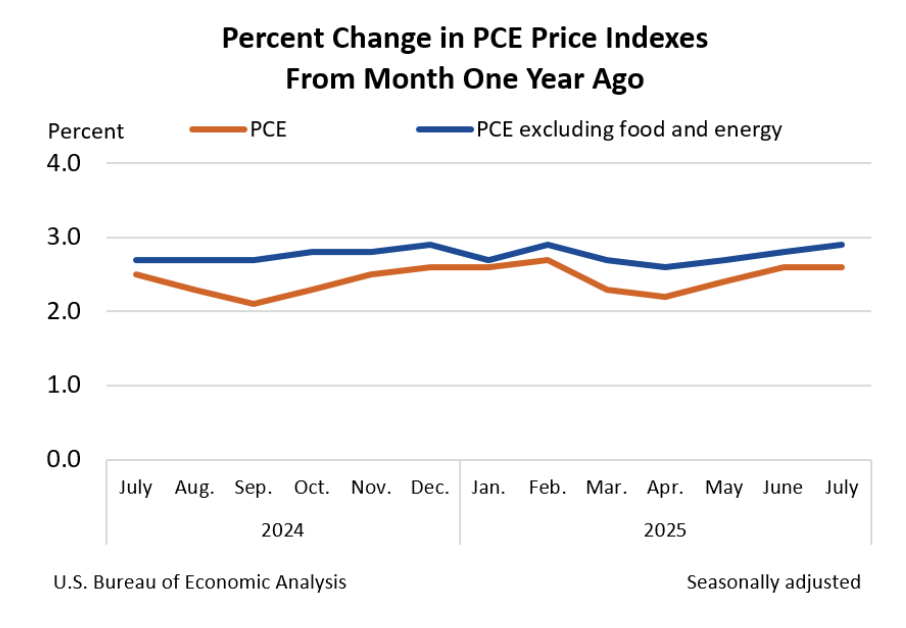
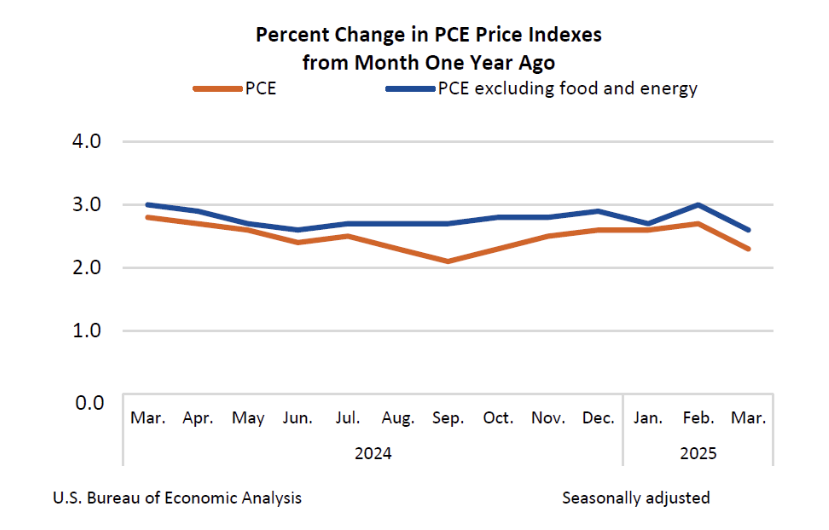
Headline PCE inflation reached +2.9% YoY and core +3.0% YoY, the highest core reading since April 2024, showing an acceleration in annual inflation.
-
Goods prices led inflation: durable goods +0.5% MoM and food +0.4% MoM; services prices rose +0.3% MoM, suggesting broader price pressures beyond services.
-
-
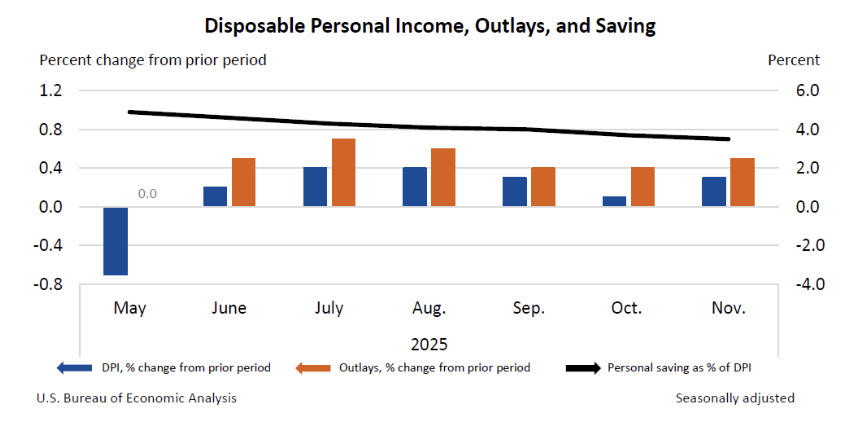
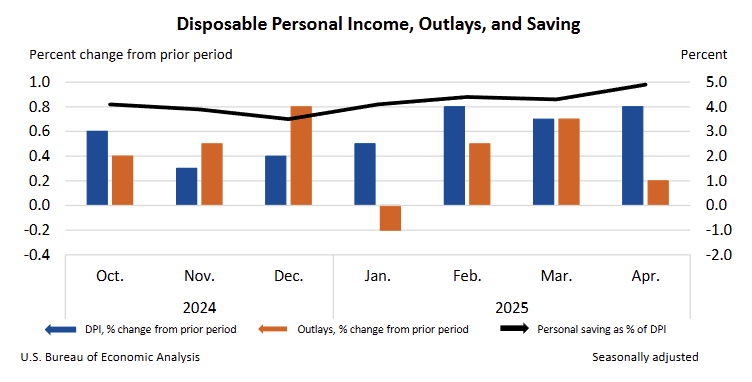
Personal income rose +0.3% MoM in November after +0.1% in October, while PCE increased +0.5% MoM in both months, showing spending continued to run ahead of income growth.
-
Personal income increased $30.6B (+0.1% MoM) in October and $80.0B (+0.3% MoM) in November, with November’s larger gain indicating firmer month-to-month income momentum.
-
Disposable personal income (DPI) rose $12.0B (+0.1% MoM) in October and $63.7B (+0.3% MoM) in November, matching the income pattern and providing only modest support for spending growth.
-
Personal consumption expenditures (PCE) increased $98.6B (+0.5% MoM) in October and $108.7B (+0.5% MoM) in November, keeping consumption growth steady across both months.
-
Personal outlays rose $97.8B in October and $107.9B in November, consistent with solid overall spending flows beyond consumption alone.
-
Personal saving fell from $843.9B in October to $799.7B in November, and the saving rate edged down to 3.5% from 3.7%, indicating a slightly smaller buffer relative to DPI.
-
The October income gain was driven mainly by higher compensation and government social benefits, partly offset by declines in other current transfer receipts from business, farm proprietors’ income, and personal dividend income.
-
The November income gain primarily reflected higher compensation and stronger personal dividend income, shifting the composition away from social benefits versus October.
-
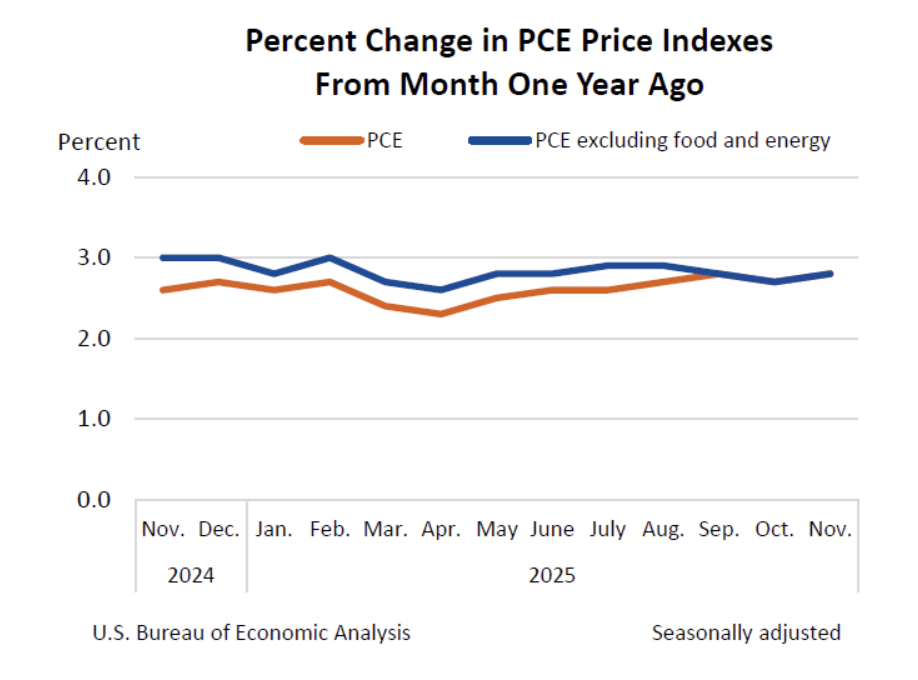
The PCE price index increased +0.2% MoM in both October and November, while YoY PCE inflation rose +2.7% in October and +2.8% in November (joint largest since March 2024); core PCE inflation (ex food and energy) also rose +0.2% MoM in both months and accelerated from +2.7% YoY to +2.8% YoY.
-
-
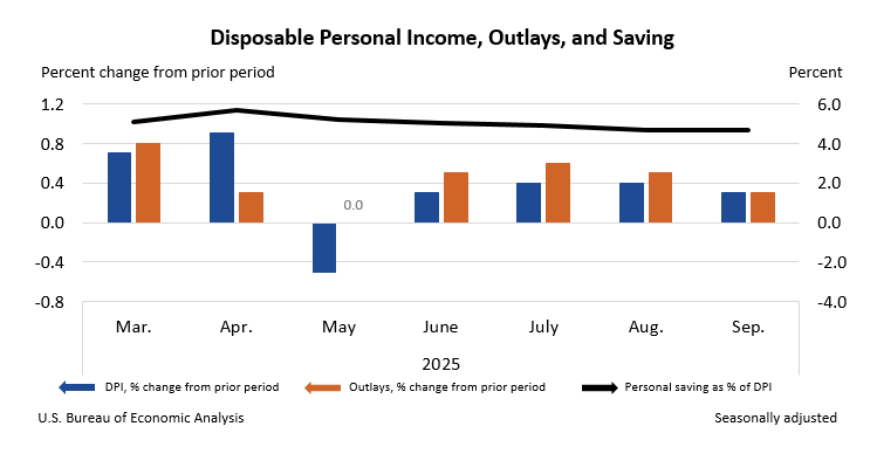
Personal income rose +0.4% MoM (vs +0.3% MoM expected) in September, while disposable income increased +0.3% MoM and PCE grew +0.3% MoM (vs +0.3% MoM expected), reflecting steady nominal income gains alongside moderate spending momentum.
-
Current dollar income increased by $94.5 billion, driven primarily by compensation and asset income, with private wages up $41.2 billion and dividend income rising $19.8 billion.
-
Disposable personal income increased $75.9 billion (+0.3% MoM), while real disposable income grew +0.1% MoM, indicating softer inflation adjusted income growth.
-
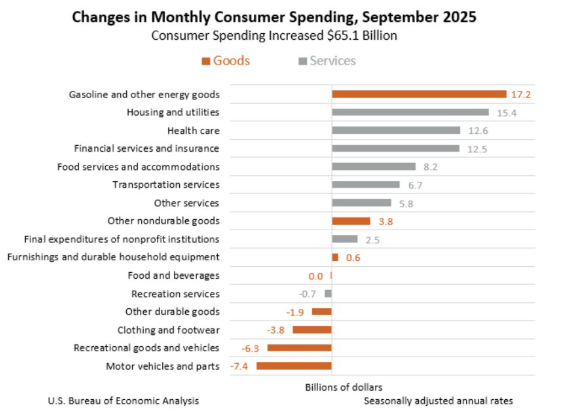
Personal consumption expenditures rose $65.1 billion (+0.3% MoM), with services accounting for nearly all of the gain (+$63.0 billion) and goods contributing a modest +$2.1 billion.
-
Real PCE was flat (0.0% MoM), suggesting that the increase in nominal spending was fully offset by price growth.
-
Half of the growth in consumer spending in September is attributed to gas & other energy goods (+$17.2 bil) and housing & utilities (+$15.4 bil).
-
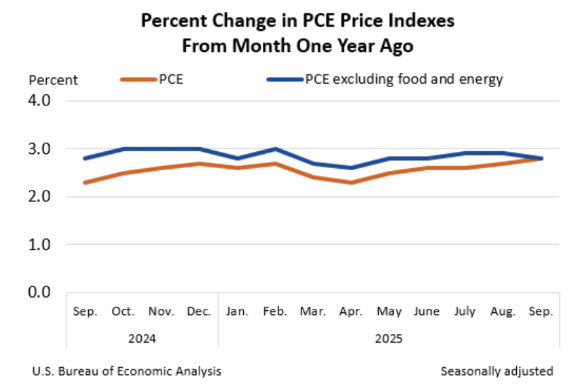
PCE prices increased 0.3% MoM (vs 0.3% MoM expected) and 2.8% YoY in September, up from 2.7% YoY in August. Core PCE prices edged up 0.2% MoM (vs 0.2% MoM expected), and the annual rate eased -0.1 ppt to 2.8% YoY (vs 2.9% YoY expected).
-
The personal saving rate held at 4.7%, with total saving at $1.09 trillion, showing limited change in household financial cushions.
-
Compensation growth broadened across categories: services wages rose $32.3 billion, goods producing wages rose $8.9 billion, and government wages increased $7.1 billion, while supplements added another $10.7 billion.
-
Spending gains were widely distributed across both goods and services categories, with notable increases in food services and accommodations, health care, and recreation services, consistent with broad based consumer activity.
-
-
Personal Income
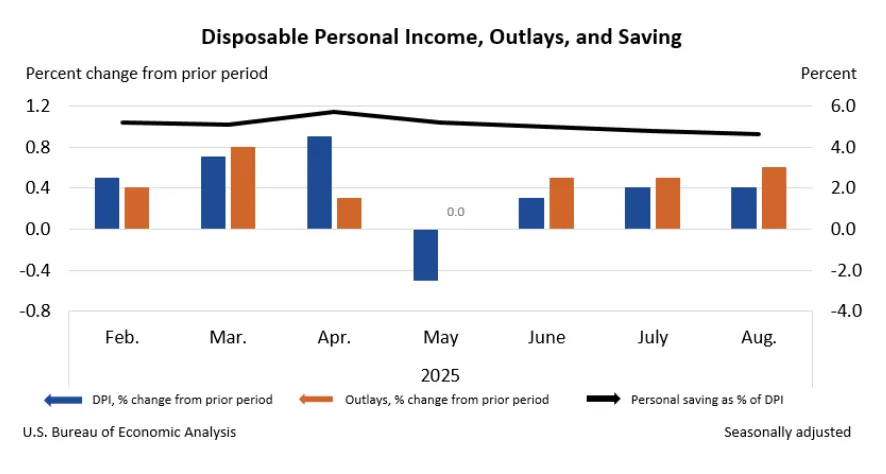
Growth in income in August continued the solid pace that we have seen earlier in the summer. Personal income increased 0.4% MoM in August, matching the pace seen in July and slightly ahead of the June increase. The increase in headline income led to a similar 0.4% MoM increase in disposable income. Both rates were in line with what analysts expected and the strongest monthly gains since April. When adjusted for inflation, income gains look a bit tamer with real disposable income growth at just 0.1% MoM.
In August, income growth was driven by two main factors:
- Employee compensation continued to increase at a decent clip, rising 0.3% MoM, supported by similar gains in wages & salaries and supplements to wages & salaries. Details point to wage gains coming almost entirely from the service sector which accounted for $28.8 billion of the increase, while the goods sector actually saw wages drop -$0.1 billion. The manufacturing industry in particular was the largest drag on wage growth, with a decline of -$2.1 billion.
- Personal current transfer receipts were the other force pushing incomes higher, with an increase of 0.6% MoM. The rise was caused by an increase in Medicare (+$10.7 billion), Medicaid (+$5.0 billion), and Social Security (+$4.8 billion) benefits, and a large $12.9 billion influx that came from a settlement with a domestic health insurance provider.
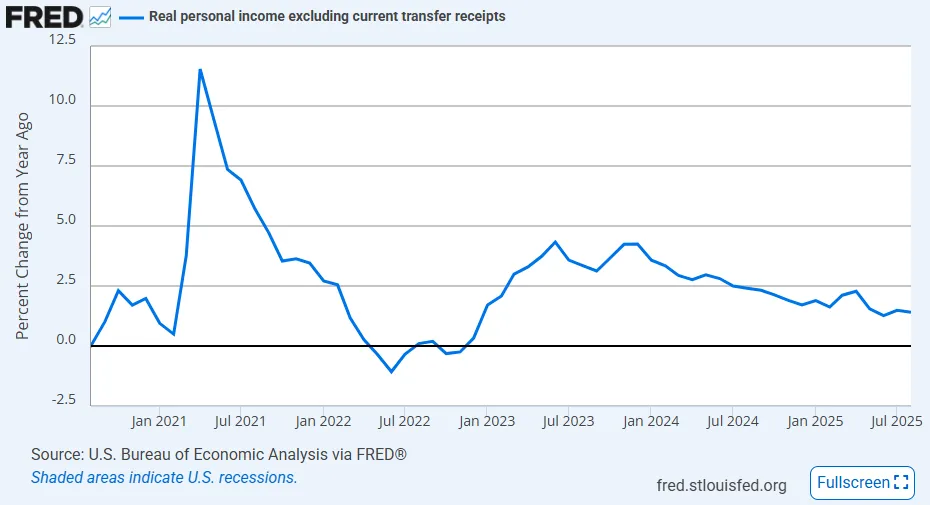
Since current transfer receipts played a significant role in boosting incomes in August, the solid rise is actually a bit misleading. When excluding transfer receipts from real personal income, there was basically no growth on a monthly basis, significantly slower than the 0.3% MoM increase in July but better than the negative prints in May and June. After the tepid reading in August, real income (ex transfer receipts) is up 1.4% YoY, down slightly from 1.5% YoY in July but significantly slower than the 2.4% YoY increase seen a year ago. Thus, the medium-trend points to a gradual slowdown in non-transfer receipt income adjusted for inflation.
Personal Spending
For the fourth consecutive month, personal consumption expenditures (PCE) growth outpaced the gains in disposable income. In August, PCE was up 0.6% MoM, slightly ahead of expectations and the strongest increase since March of this year. Spending increased in both goods and services categories, with the former up 0.8% MoM and the latter up 0.5% MoM. Both categories of spending have been strong over the summer, suggesting the consumer has been stable enough to make purchases even though prices continue to rise. Indeed, even when adjusted for inflation, consumption growth was still a solid 0.4% MoM in August.
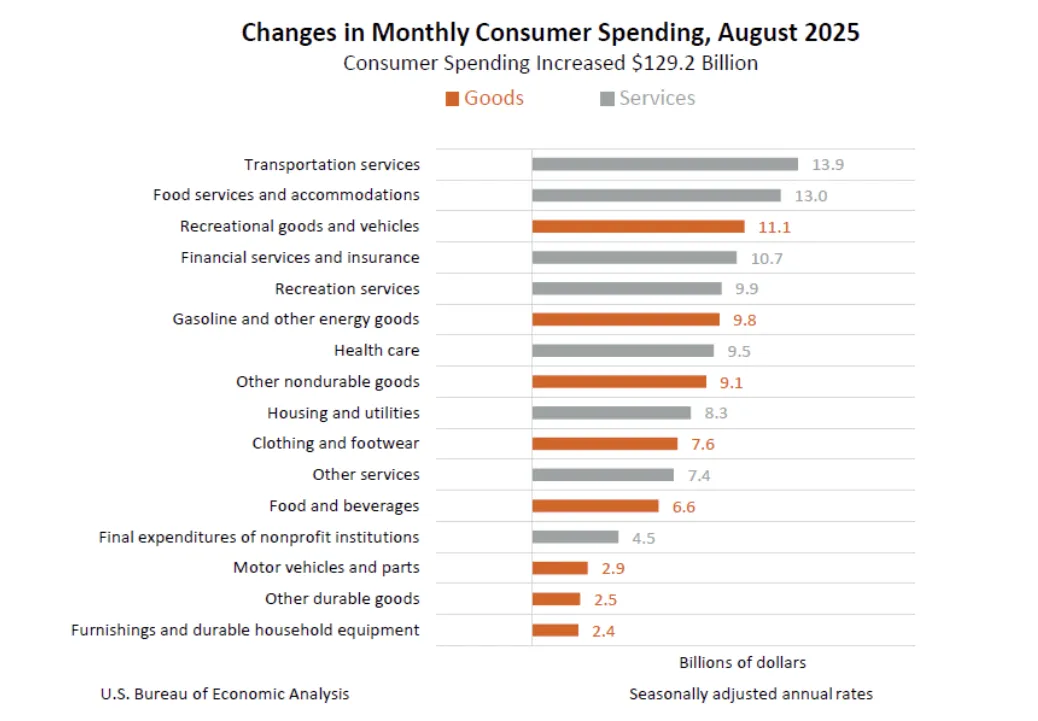
Within the segments of consumer spending, we see a lot of the increase driven by discretionary categories. The categories that especially stick out are food services & accommodations (+$13.0 billion), recreational goods & vehicles (+$11.1 billion), and recreation services (+$9.9 billion). It is also notable to point out that these weren’t the only categories that saw increases; spending in every goods and services category grew. When consumers are spending more on everything, especially discretionary goods, it is usually a signal that they feel pretty confident in their financial situations.
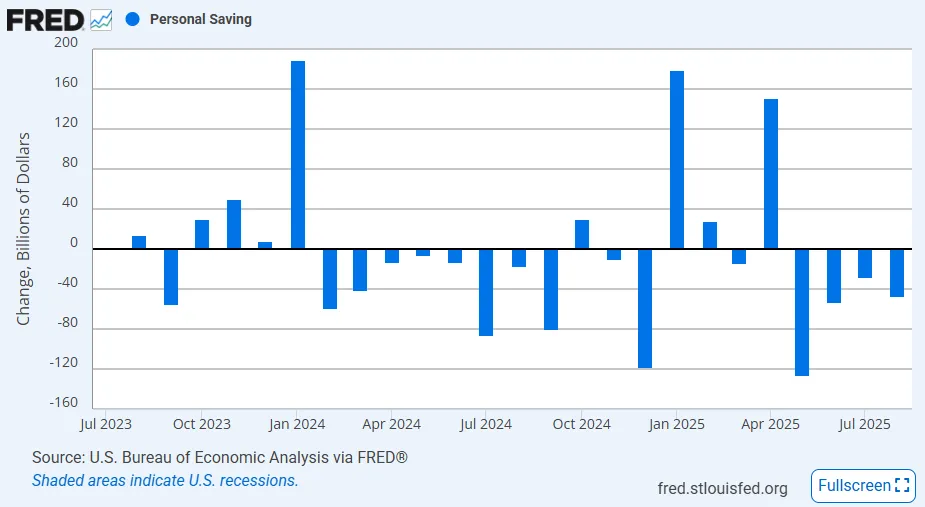
However, it is unclear how much longer this trend can continue. As mentioned before, income growth is slowly but consistently fading away and not keeping pace with consumption growth which is putting most consumers’ finances in the red. Monthly personal savings were negative for the fourth straight month, and over that time period, consumers have drained over $250 billion from stored savings (or they are increasing debt loads). This trend isn’t necessarily new, but the last few months of negative savings have been particularly high, making the magnitude of the decline unusually high (of course that was offset by a strong $150.7 billion increase in savings in April).
PCE Inflation
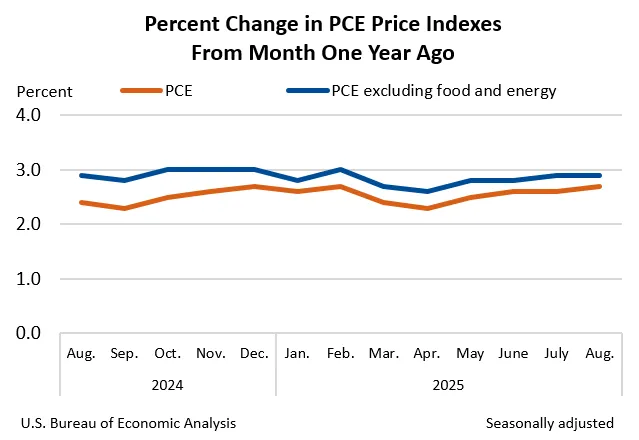
The PCE inflation figures for August were unsurprising as both the monthly and annual rates were in line with expectations. The headline PCE index increased 0.3% MoM and 2.7% YoY, up slightly from 2.6% YoY in July. Both rates were on the hotter side relative to data this year. The MoM increase was the strongest since February, and the annual rate was the strongest since April. This was caused by strong gains in the food and energy indexes, which were up 0.5% MoM and 0.8% MoM, respectively. Notably, food inflation has been on a consistent rise throughout the year and is now at 2.2% YoY, the highest since October 2023.
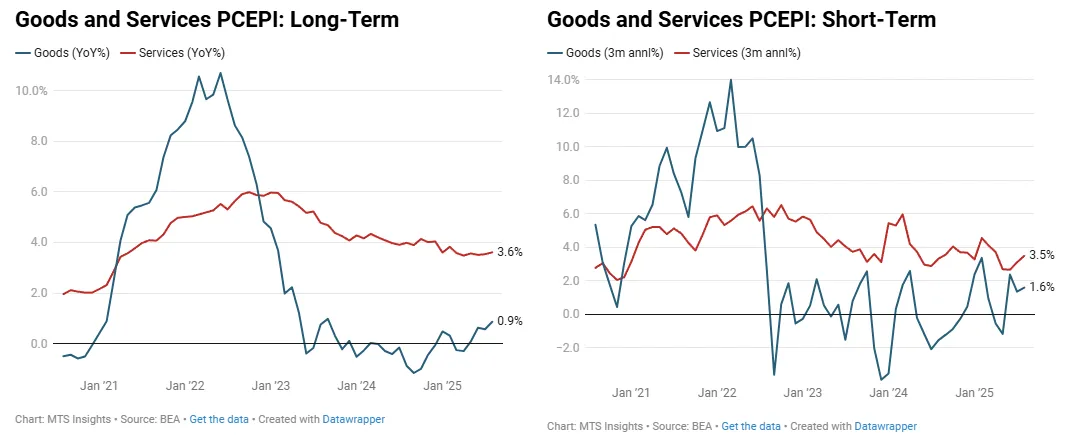
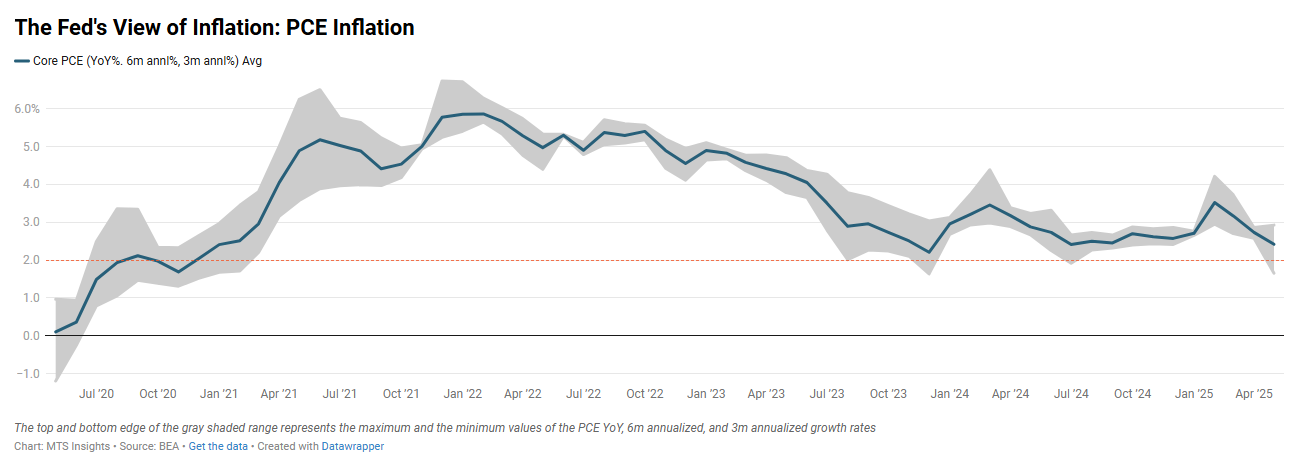
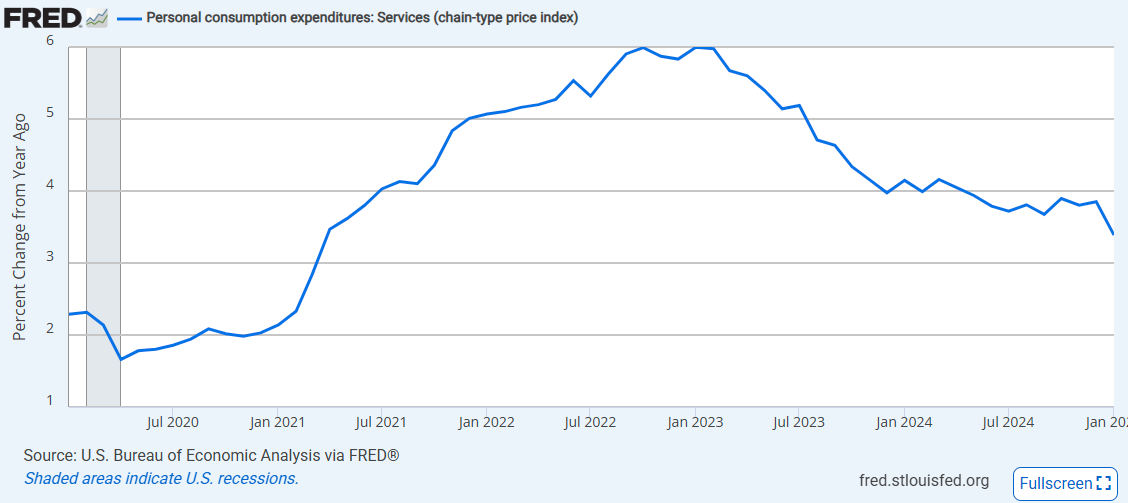
The Fed’s preferred inflation gauge, core PCE inflation, also saw a moderate rise of 0.2% MoM, but it wasn’t enough to move the annual rate above 2.9% YoY. Both readings were in line with expectations. The services segment was the main driver of price growth in August, rising 0.3% MoM, while goods prices were more contained at 0.1% MoM, thanks to a second straight -0.1% MoM decline in durable goods prices. Unlike the CPI report, we are not seeing as strong of an upward push from goods inflationary pressure in the PCE price data in the short-term. Instead, it is a bump up in short-term services inflation that is keeping core PCE inflation sticky (see chart on the right).
-
Personal income increased 0.4% MoM (vs 0.4% MoM expected) in July, with disposable personal income up 0.4% MoM as well.
- Personal consumption was up 0.5% MoM (vs 0.5% MoM expected), driven by higher spending on autos and financial services.
- Real PCE rose +0.3% MoM, with services spending up +$60.2 billion and goods spending up +$48.7 billion.
- In July, personal income growth was driven by higher wages and salaries (+0.6% MoM) and non-wage supplements to income (+0.5% MoM).
- Personal transfer receipts were flat on the month, and personal income from assets was only up 0.1% MoM.
- The personal saving rate fell to 4.4% in July, down from prior levels, with total personal saving at $985.6 billion.
-
The PCE price index increased 0.2% MoM (vs 0.2% MoM expected) and remained up 2.6% YoY (vs 2.6% YoY expected) in July.
-
Core PCE inflation was 0.3% MoM and 2.9% YoY, both in line with expectations. The annual rate ticked up 0.1 ppts from June and was the highest since March.
-
The June personal income and outlays report highlighted a concerning dynamic for policymakers: soft income and spending growth paired with firmer-than-expected inflation. Personal income rose just 0.3% MoM while personal consumption also increased 0.3% MoM, below expectations. Yet, both headline and core PCE inflation accelerated to 0.3% MoM, driven by a broad pickup in goods prices, likely reflecting early impacts from new tariffs. The data reinforces the Fed’s cautious stance, with short-term inflation gauges suggesting the disinflationary momentum of early 2025 has faded.
Income and Spending
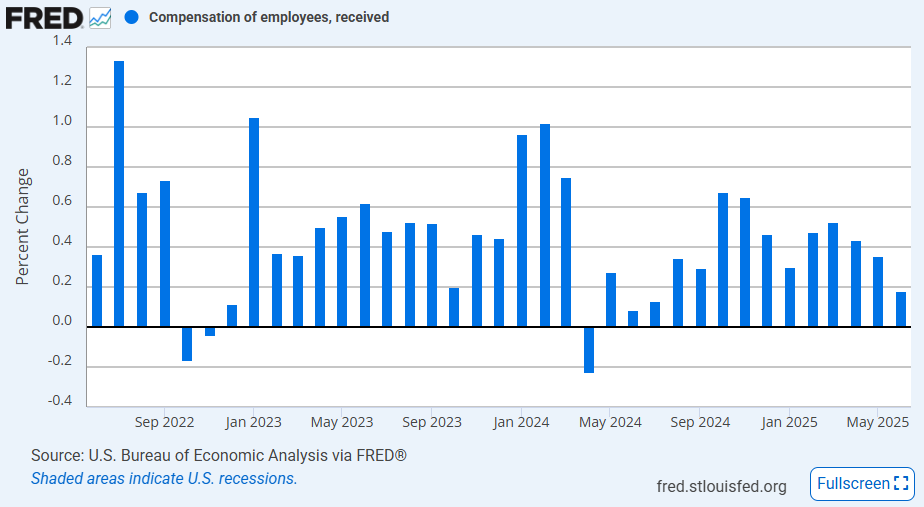
Income continued to show a trend of gradual moderation in the final month of the second quarter after a bit of volatility in April and May. In June, personal income increased just 0.3% MoM, the weakest monthly increase since November 2024 when excluding the previous two months (which were impacted due to volatility in transfer receipts). Notably, this month saw just a 0.2% MoM increase in employee compensation with wages & salaries up just 0.1% MoM. This was the weakest MoM gain in compensation since a year ago, when the Fed judged their to be a noticeable uptick in labor market looseness.
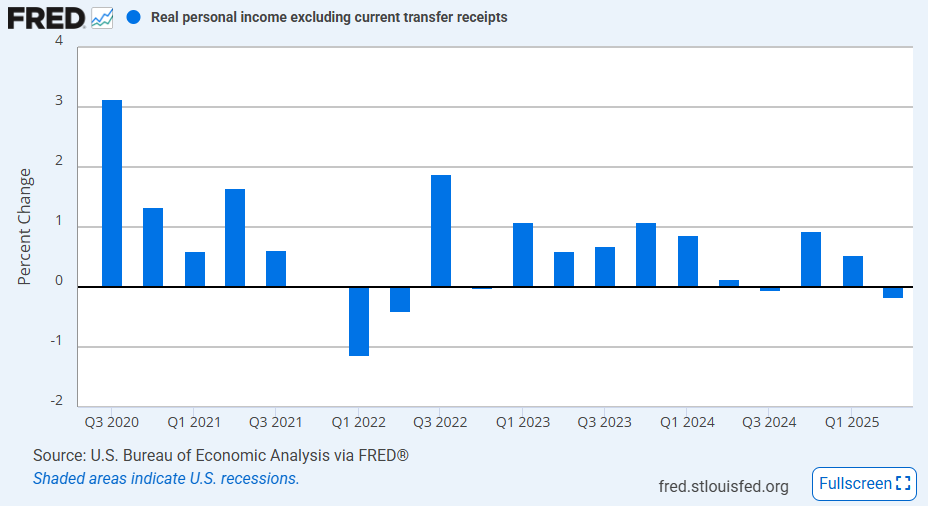
While there was weakness in compensation growth, disposable income growth was also 0.3% MoM as personal transfer receipts increased 1.0% MoM and personal taxes only increased 0.3% MoM (lowest increase since April 2024). An even more troubling view on income can be created by excluding personal transfer receipts and adjusting for inflation. That measure was down -0.2% MoM in June, matching the decline of -0.2% MoM in May. When looking at Q2 as a whole, real personal income (ex-current transfer receipts) was down -0.2% QoQ, the weakest since a -0.4% QoQ drop in Q2 2022.
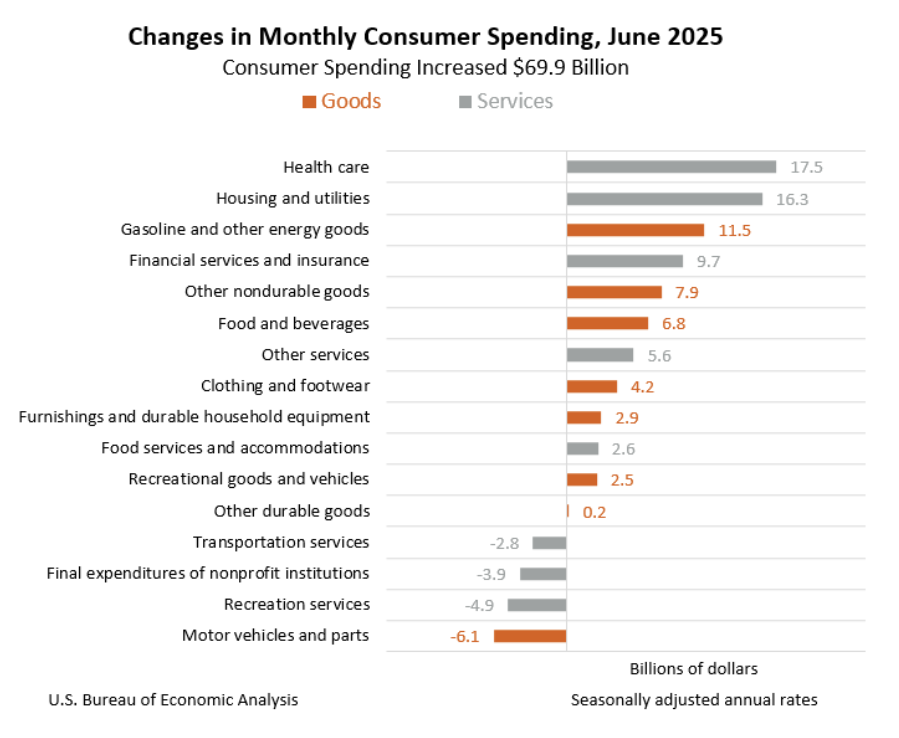
Tame income growth appears to have tempered the gain in personal consumption expenditures. After no change in May, personal spending was up just 0.3% MoM, falling short of an expected 0.4% MoM increase. Spending growth across goods and services was pretty similar with the former up 0.5% MoM and the latter up 0.3% MoM. The breakdown of spending shows that the largest increases in spending were in health care, housing, and energy goods. Discretionary categories like furnishings, recreational goods & services, and food services & accommodations all saw no growth to a small decline. A drop in spending on vehicles in June also weighed on spending. What is more troubling is that even though personal consumption growth was relatively tame, the weakness in personal income growth led to a -$8.5 billion decline in personal savings.
PCE Inflation
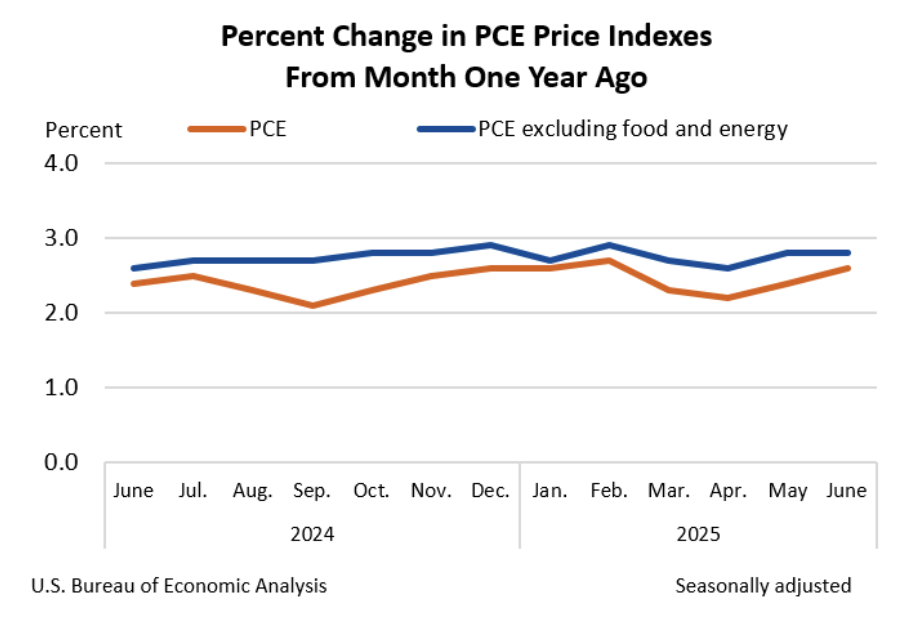
Even though spending and income growth rates were subdued in June, the PCE price indexes posted their largest monthly gains since February. The headline PCE index increased 0.3% MoM and 2.6% YoY in June, with the monthly rate in line with forecasts and the latter slightly ahead of the 2.5% YoY expected gain. A bounce back in energy was the main reason for the acceleration in the headline annual rate with that subindex up 0.9% MoM. Food prices were also up a decent clip, rising 0.3% MoM. With PCE inflation back up to 2.6% YoY, the disinflation over the last three months from weaker energy prices has basically vanished.
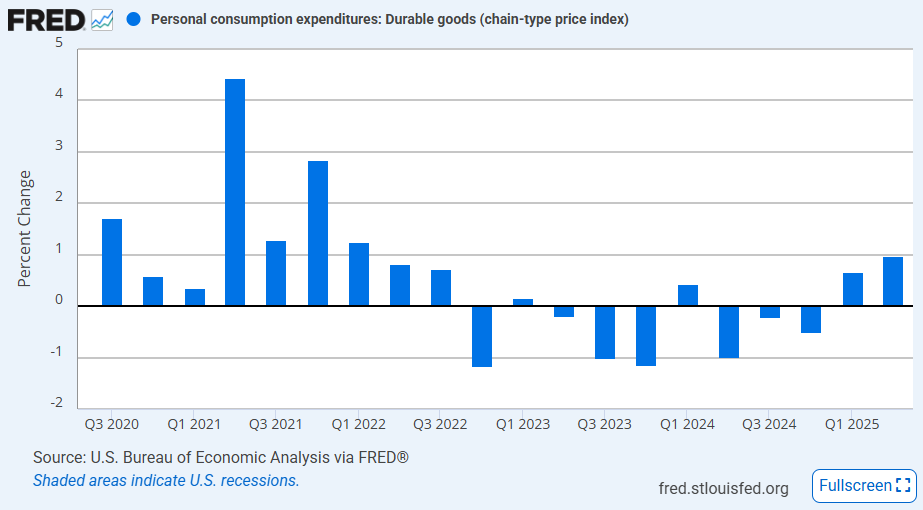
The Fed’s preferred inflation measure, core PCE inflation, was 0.3% MoM and 2.8% YoY in June. Like the headline index, the monthly rate was in line with expectations, while the annual rate beat by 0.1 ppts. Driving core PCE prices higher was a 0.4% MoM increase in the goods segment, the largest since January of this year, reflecting the rise in goods inflation seen in the June CPI report. The goods rise was pretty even across durable (+0.5% MoM) and nondurables (+0.4% MoM), but the durable move was the second largest since September 2022. It’s hard not to see tariffs in this move, especially when spending growth on durables was nonexistent. In Q2 as a whole, durable goods prices increased 1.0% QoQ, the largest quarterly increase since Q1 2022. Outside of goods, the PCE services segment was up 0.2% MoM for the fourth straight month, not playing much of a major role in the overall core PCE index change.
-
The latest personal income and spending data for May delivered a downside surprise, adding to concerns raised by the downward revision to Q1 GDP growth just a day earlier. At first glance, the report looks soft, with both income and consumption missing expectations. However, a closer look reveals that much of the weakness stems from temporary volatility in key components like government transfers and proprietors’ income. Meanwhile, PCE inflation figures came in slightly firmer than forecast, reinforcing the Fed’s cautious stance as it awaits more clarity on the inflation path.
Income and Spending
Income and spending data for May came in notably weak, compounding the pain felt from the downward revision to GDP growth in the final estimate released yesterday. Today’s personal income and outlays report reveals that personal income fell -0.4% MoM in May, slowing significantly from the 0.7% MoM increase in April and coming in well below the forecast of a slight 0.3% MoM gain. The drop in disposable income was slightly worse at -0.6% MoM, the worst drop since January 2022. These headline figures look quite soft, but the underlying data suggests they can be attributed to month-to-month volatility.
There was a large decline in personal current transfer receipts in May of -$110.4 billion, and more specifically, in Social Security benefits distributed, down -$122.4 billion, after that segment perked up in April, up $107.6 billion. The volatility in this segment more than offset the gains in employee compensation which were stable at 0.4% MoM across both April and May. Another segment that caused the downside surprise was a decrease in proprietors’ income, down -2.3% MoM in May after growth of 1.6% MoM in March and 1.2% MoM in April.
Alongside weak income data, we see a weak personal consumption expenditures (PCE) print that reflected the drop in retail sales earlier this month. PCE fell -0.1% MoM in May, the second monthly decline so far this year (first was in January) and below expectations of a slight 0.1% MoM gain. The drop was driven by goods spending down -0.8% MoM, especially durable goods spending which was down -1.8% MoM, while services spending was positive but the slowest since November 2020 at 0.1% MoM. The trend in goods spending is consistent with the retail sales blip that was caused by consumers front-running tariffs.
PCE Inflation
The Fed has been in the spotlight ever since it decided to keep rates unchanged following its June FOMC meeting as Fed Governors Waller and Bowman came out shortly after with dovish remarks and President Trump launched attacks on Chair Powell. This week, the focus on the Fed came in the form of Powell’s presentation of the Semiannual Monetary Policy Report in front of Congress. To close the week, we get the May update of the Fed’s preferred inflation gauge.
Headline PCE inflation for May was reported at 0.1% MoM and 2.3% YoY, slightly higher than the 2.2% YoY annual rate reported in April and in line with expectations. Core PCE inflation, the metric watched by the Fed, came in slightly ahead of expectations at 0.2% MoM (vs 0.1% MoM expected) and 2.7% YoY (vs 2.6% YoY expected). Ignoring analyst projections, inflation was pretty calm across all subsegments. Goods prices were up just 0.1% MoM, and services prices were up 0.2% MoM (rounded up from 0.17% MoM). Food prices increased 0.2% MoM, and energy prices fell for the 2nd time in three months, down -1.0% MoM.
While annual core PCE inflation did accelerate slightly, short term inflation pressure is now trending at the Fed’s target. The annualized rate of the quarterly change in core PCE inflation is at 1.7% with goods prices in deflation and services prices just above target at 2.1% using the same measure. This data is now the same or slightly softer than the data that the Fed was dealing with when it chose to cut rates by 50 bps in September 2024. It is safe to say that inflation data over the last three months would contribute to a case for a rate cut.
-
Personal income increased 0.8% MoM in April, well above expectations of a 0.3% MoM gain. Real disposable income growth was a strong 0.7% MoM.
- Despite strong income growth, PCE increased just 0.2% MoM, in line with expectations, as goods spending fell -0.1% MoM and services spending increased 0.4% MoM.
- Services spending increased $55.8 billion, led by spending in housing & utilities (+$24.7 bil) and health care (+$20.3 bil), offsetting an $8.0 billion decline in goods spending.
- The personal saving rate rose 0.6 ppts to 4.9%, with total savings at $1.12 trillion.
- The PCE Price Index was up just 0.1% MoM and 2.1% YoY in April, slowing from 2.3% YoY in March and below expectations of a 2.2% YoY increase.
- Core PCE inflation slowed to 2.5% YoY in April, down from 2.7% YoY in March and the lowest since March 2021.
-
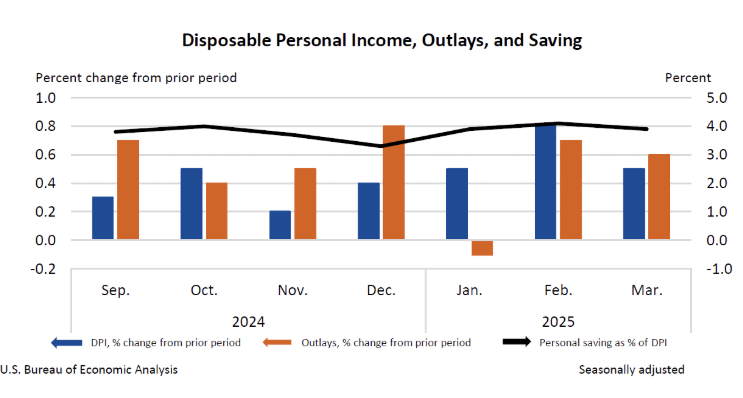
US personal income increased 0.5% MoM, and personal consumption expenditures increased 0.7% MoM in March. Both were above expectations of 0.4% MoM and 0.5% MoM, respectively.
- Disposable personal income increased 0.5% MoM and was up by 0.5% or more on a monthly basis in each month in Q1 2025.
- Real disposable income increased 0.5% MoM, the highest since January 2024.
- Goods spending increased 0.9% MoM with durable spending surging 3.2% MoM (on strong auto sales), and services spending increased 0.6% MoM.
- The PCE price index was unchanged on a monthly basis and up 2.3% YoY, slightly ahead of expectations of a 2.2% YoY increase.
- The core PCE price index was also unchanged on a monthly basis and up 2.6% YoY, in line with expectation and the lowest annual rate since March 2021.
-
US personal income increased 0.8% MoM, and personal spending increased 0.4% MoM in February, the second straight month of income growth outpacing spending growth.
- US personal income increased 0.8% MoM, above 0.4% MoM expected and the largest monthly increase since January 2024. Disposable income growth was 0.9% MoM, also the largest since January 2024.
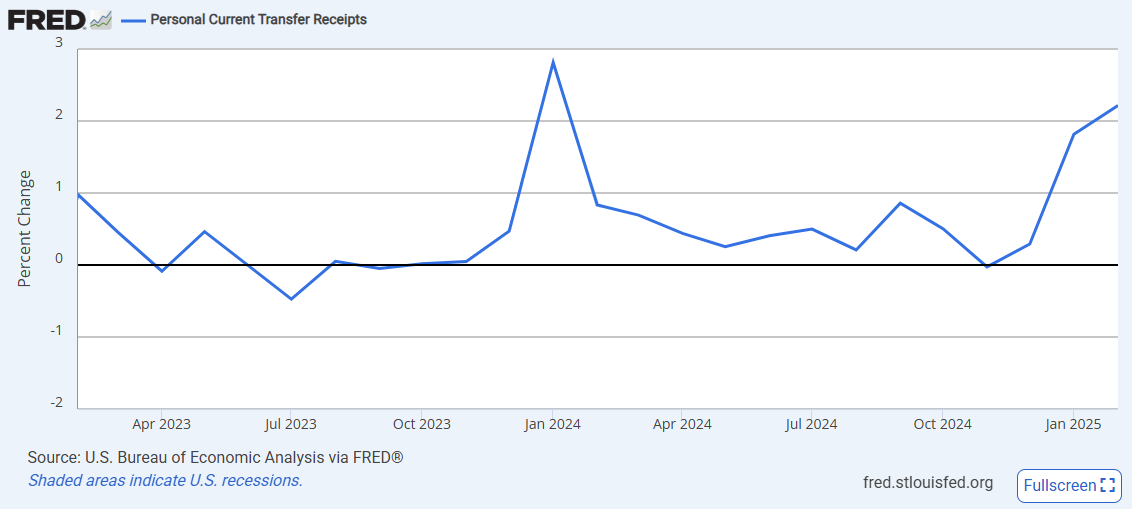
- The large increase in personal income was partly caused by a strong 2.2% MoM increase in personal current transfer receipts which could be a result of an increase in unemployment insurance payouts from DOGE layoffs or government buyouts of federal employees.
- At 4.6%, the personal savings rate was the highest since June 2024.
- Personal consumption expenditure was up 0.4% MoM, falling short of expectations of an 0.5% MoM increase but the largest of 2025 so far. Real personal spending growth was just 0.1% MoM.
- Goods spending was up 0.9% MoM in February after a -1.7% MoM drop in January, likely driven by stronger auto sales.
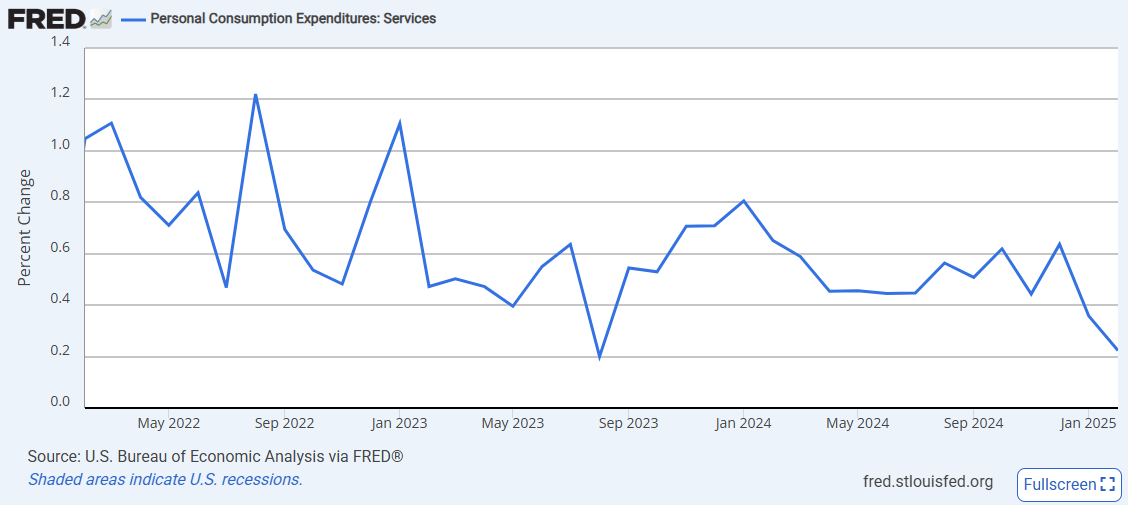
- Services spending was up just 0.2% MoM, the lowest monthly increase since August 2023.
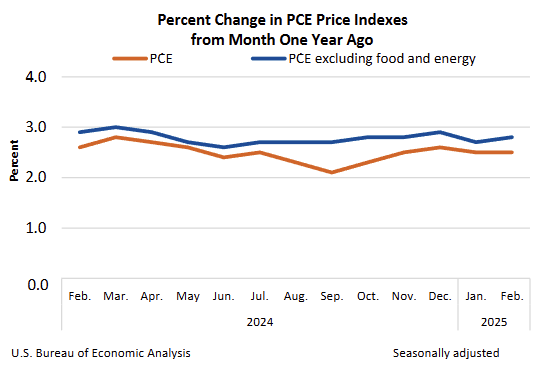
The PCE price index was up 0.3% MoM and 2.5% YoY in February, in line with expectations and unchanged from January.
- The core PCE price index was up 0.4% MoM and 2.8% YoY in February, slightly above expectations of 0.3% MoM and 2.7% YoY. The annual rate was a tick higher than the January rate of 2.7% YoY.
- The food component was flat on a monthly basis, and energy was up 0.1% MoM.
- The PCE goods index was up 0.2% MoM and 0.4% YoY (prev 0.6% YoY), and the PCE services index was up 0.4% MoM and 3.5% YoY (prev 3.4% YoY).
-
Personal income jumped 0.9% MoM (vs 0.3% MoM expected), and personal spending fell -0.2% MoM (vs 0.1% MoM expected) in January, the weakest since an -0.6% MoM drop in February 2021.
- Wages and salaries were up 0.4% MoM while supplements to compensation jumped 0.6% MoM.
- Disposable personal income jumped 0.9% MoM, the largest increase since January 2024.
- Goods spending was down -1.2% MoM with durables spending down -3.0% MoM and nondurables down -0.2% MoM, and services spending was up 0.3% MoM.
- Real consumer spending was down -0.5% MoM, also the weakest since February 2021.
- The drop in spending was a result in a large -$41.1 billion decline in motor vehicle & parts spending and a -$14.9 billion drop in spending on recreation goods.
- This was offset by increase in spending on housing & utilities (+$29.0 billion) and food services and accommodations (+$13.0 billion), the two largest segments of spending growth in January.
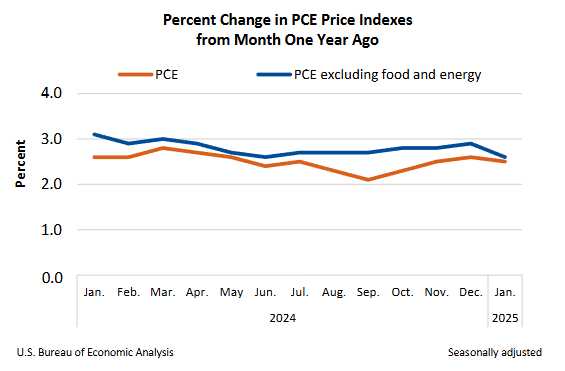
The PCE price index increased 0.3% MoM and 2.5% YoY, in line with expectations.
- The energy index jumped 1.3% MoM and was up 1.0% YoY, the first positive annual rate since July 2024.
- Food prices saw a moderate increase of 0.3% MoM and were up 1.6% YoY.
- Core PCE inflation was 0.3% MoM and 2.5% YoY (down from 2.6% YoY previously), both also in line with expectations.
- Goods prices advanced 0.5% MoM on strong energy with durables up 0.3% MoM and nondurables up 0.6% MoM. Goods annual rate was 0.6% YoY, the first positive reading in around a year.
- Services prices were only up 0.2% MoM and the annual rate eased to 3.4% YoY (from 3.9% YoY previously), the lowest since March 2021.