US Pending Home Sales
- Source
- NAR
- Source Link
- https://www.nar.realtor/
- Frequency
- Monthly
- Next Release(s)
- March 17th, 2026 10:00 AM
-
April 21st, 2026 10:00 AM
-
May 19th, 2026 10:00 AM
-
June 17th, 2026 10:00 AM
-
July 16th, 2026 10:00 AM
-
August 18th, 2026 10:00 AM
-
September 17th, 2026 10:00 AM
-
October 20th, 2026 10:00 AM
-
November 18th, 2026 10:00 AM
-
December 17th, 2026 10:00 AM
Latest Updates
-
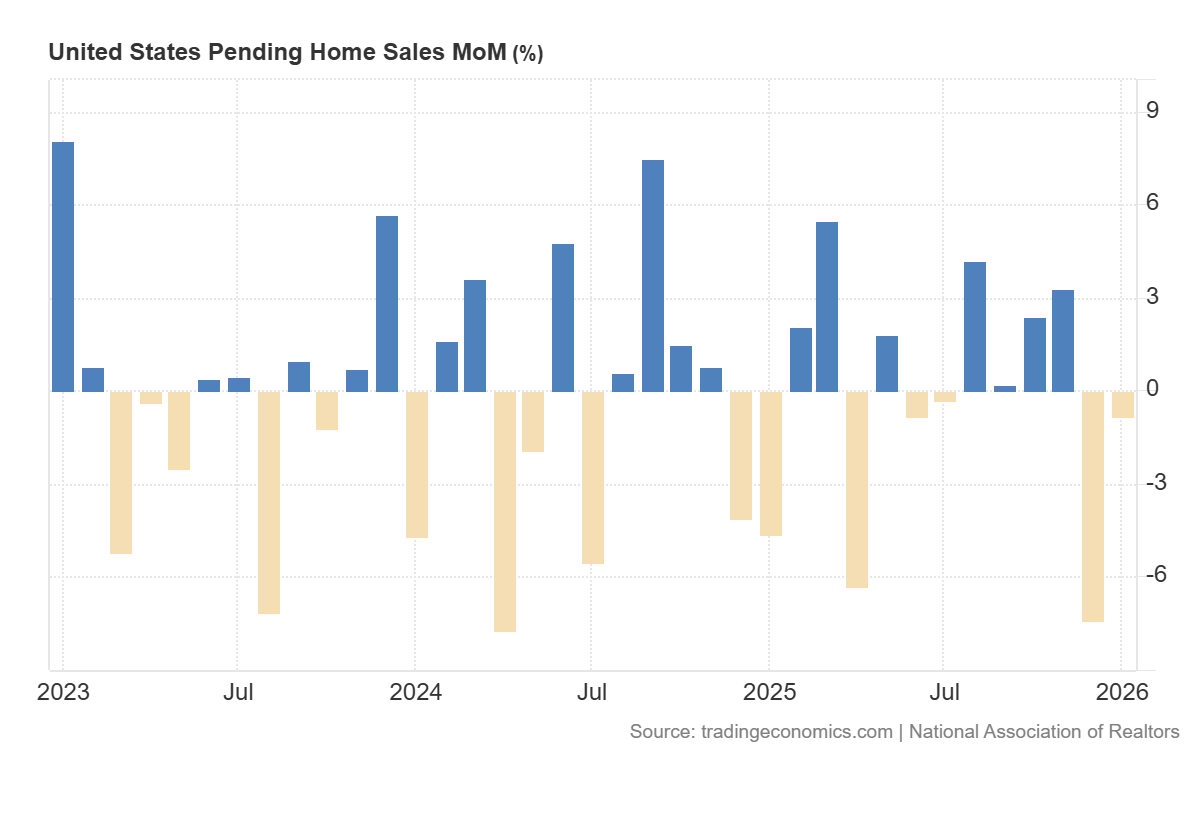
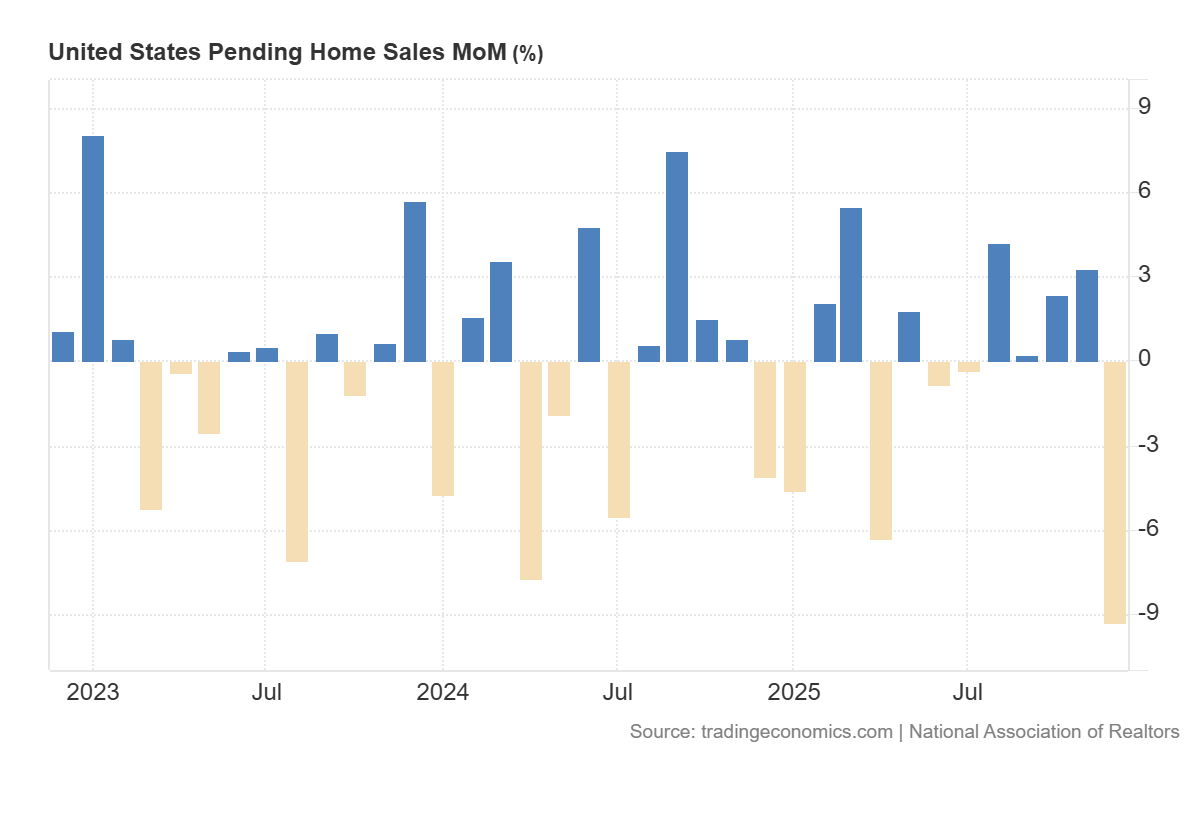
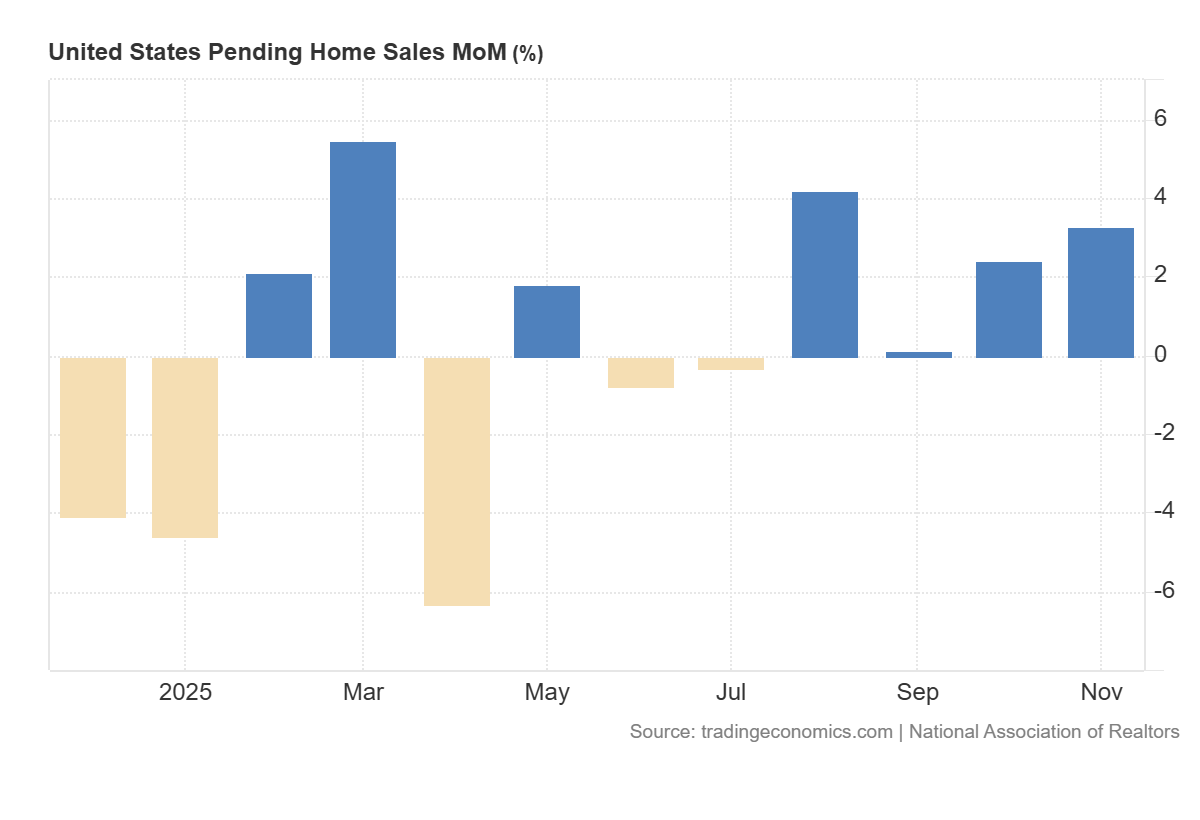
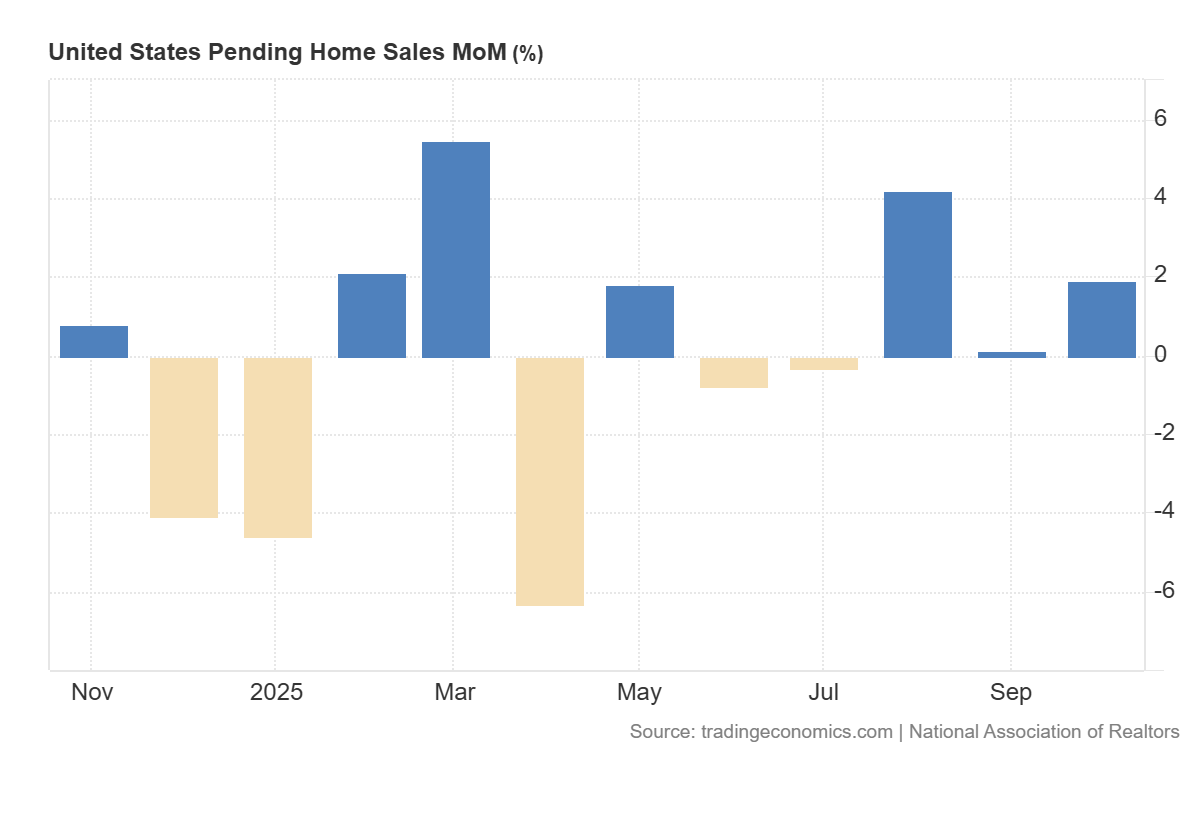
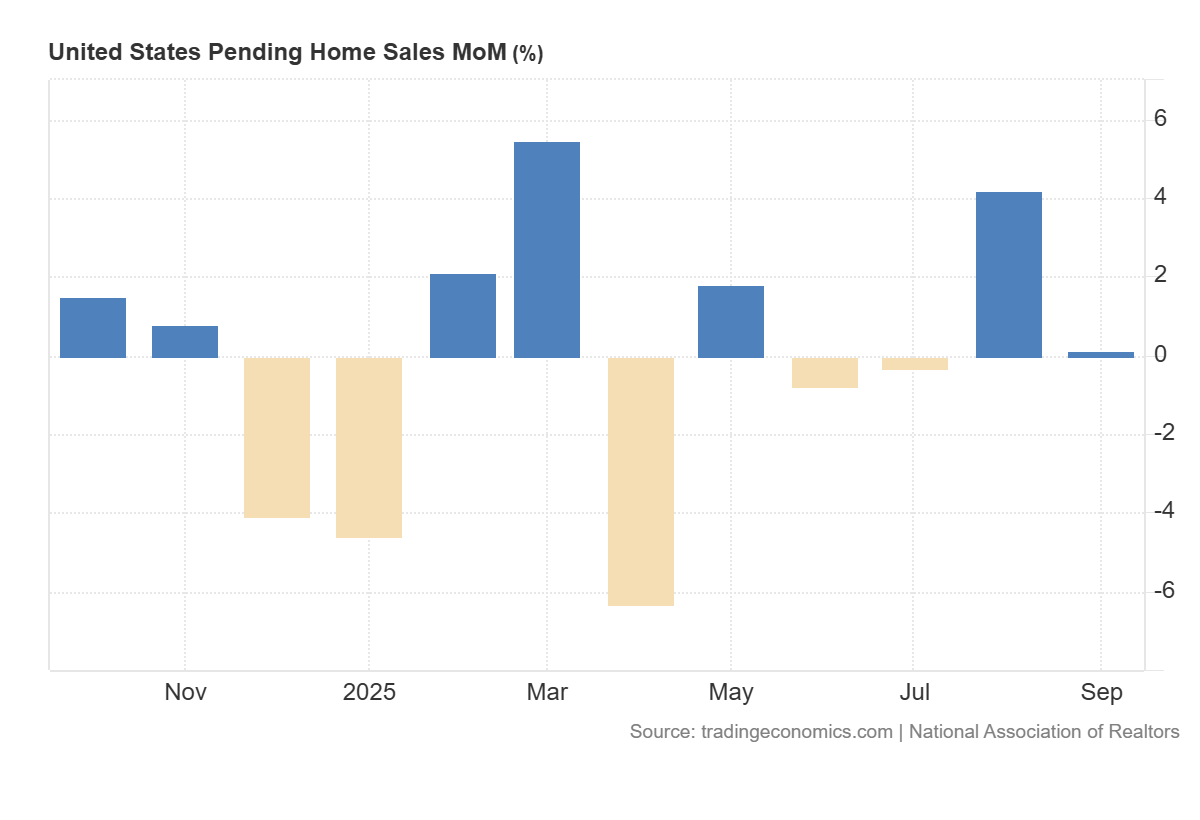
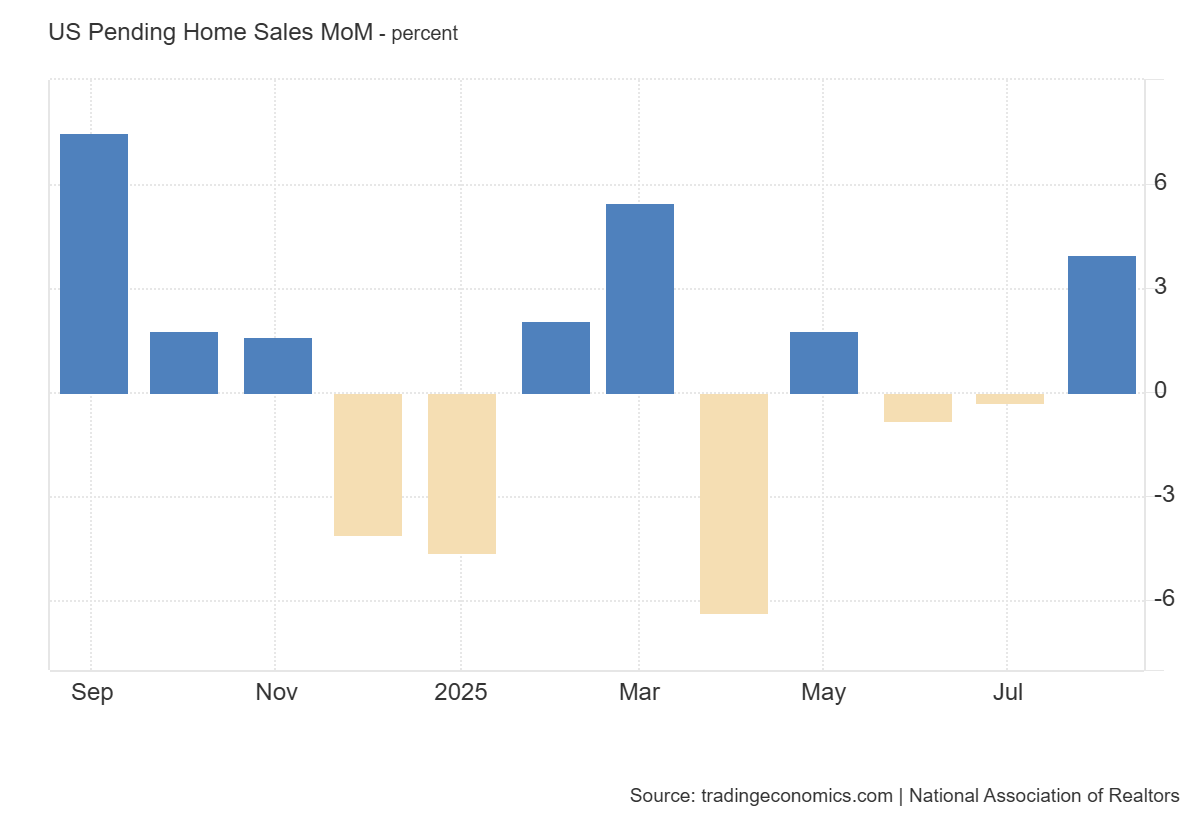
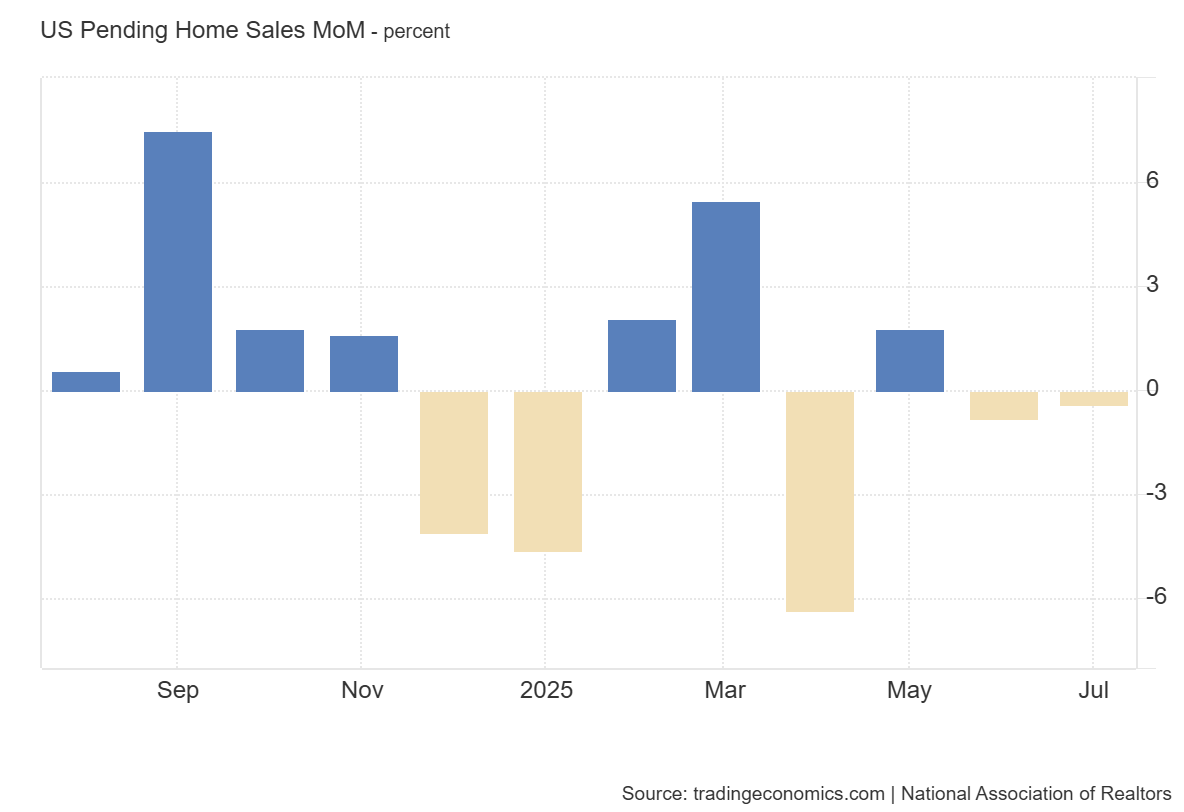
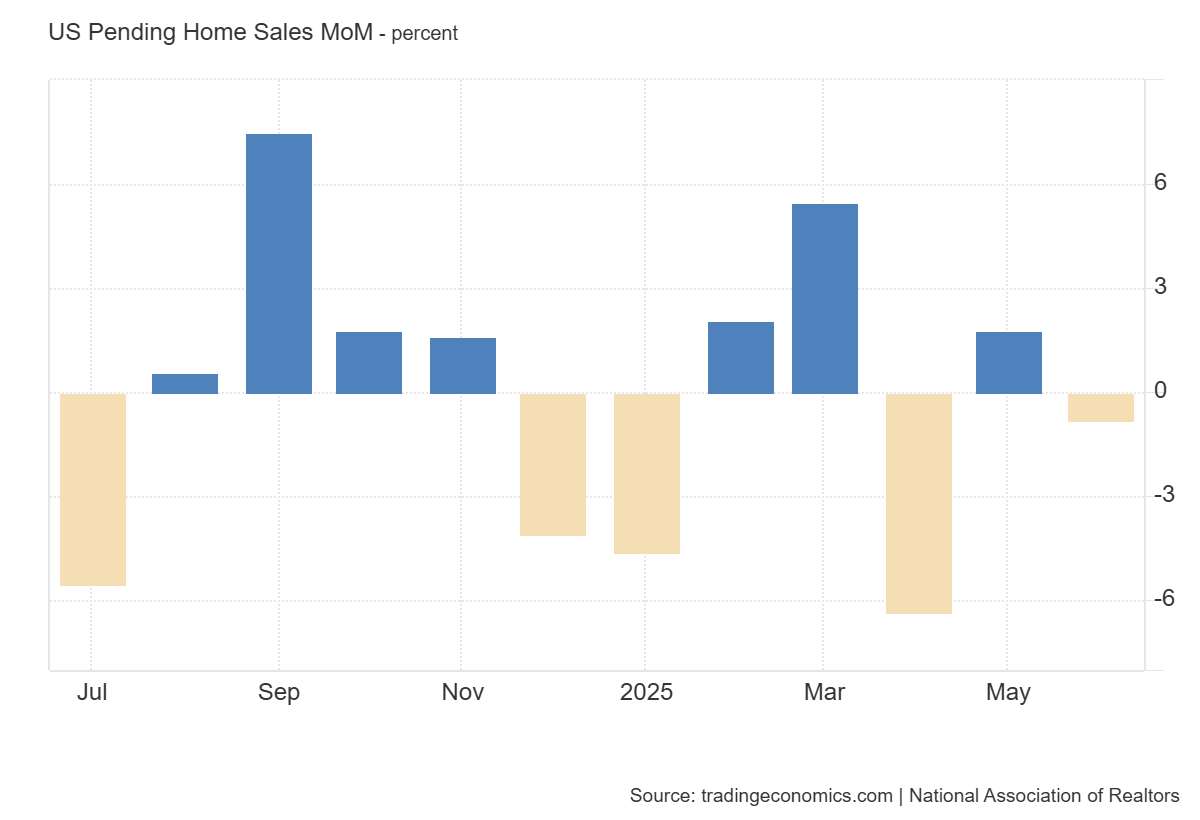
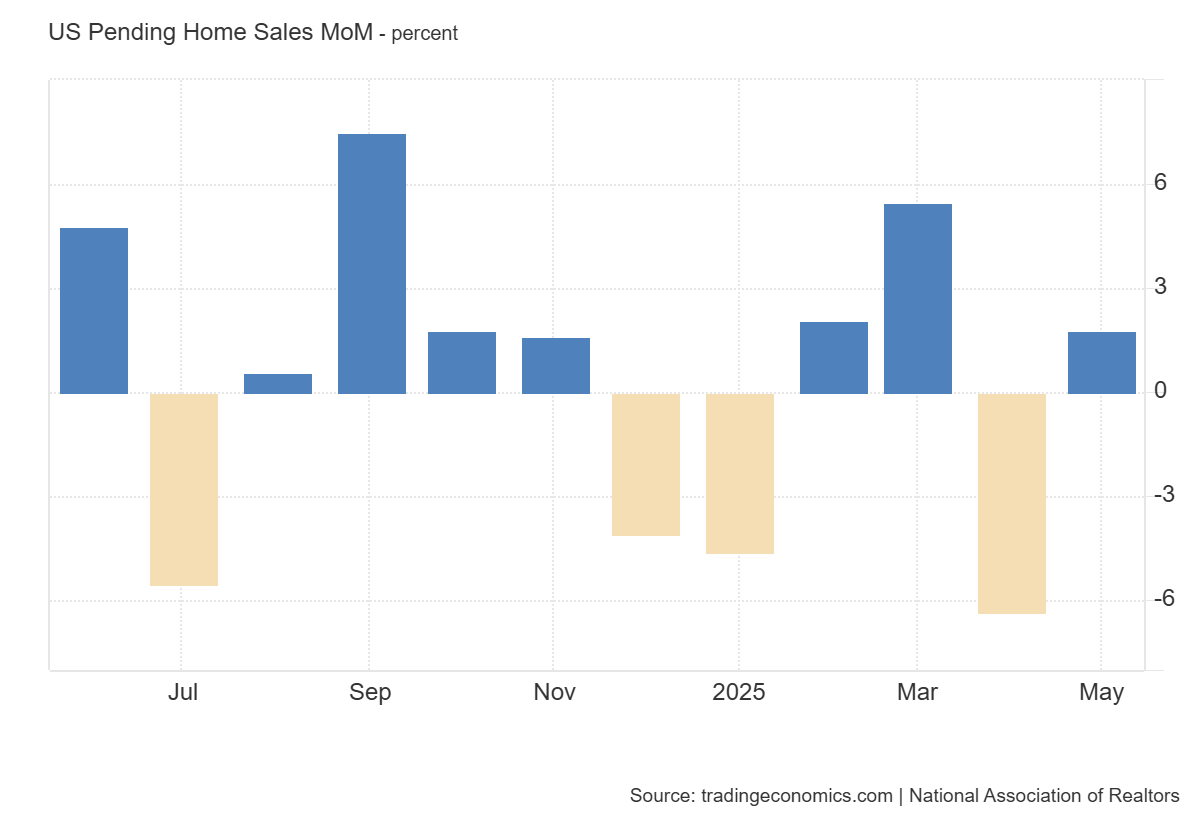
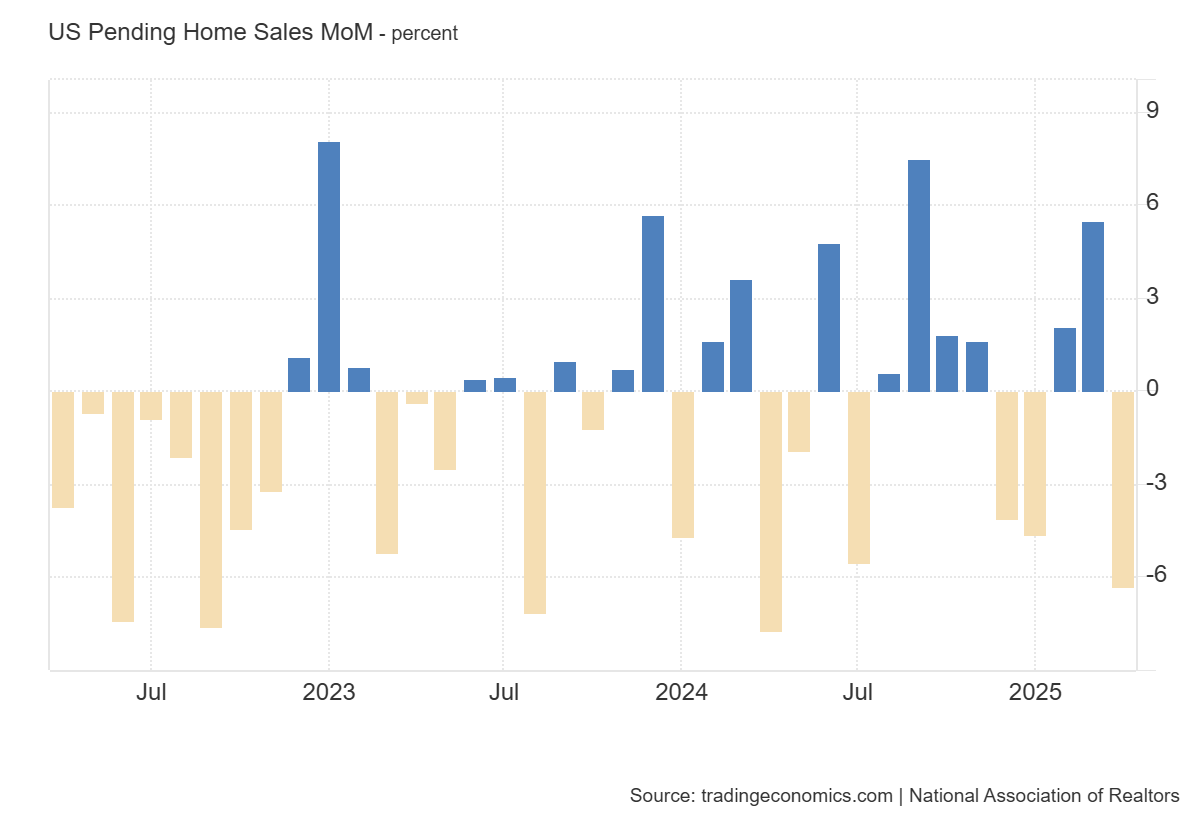
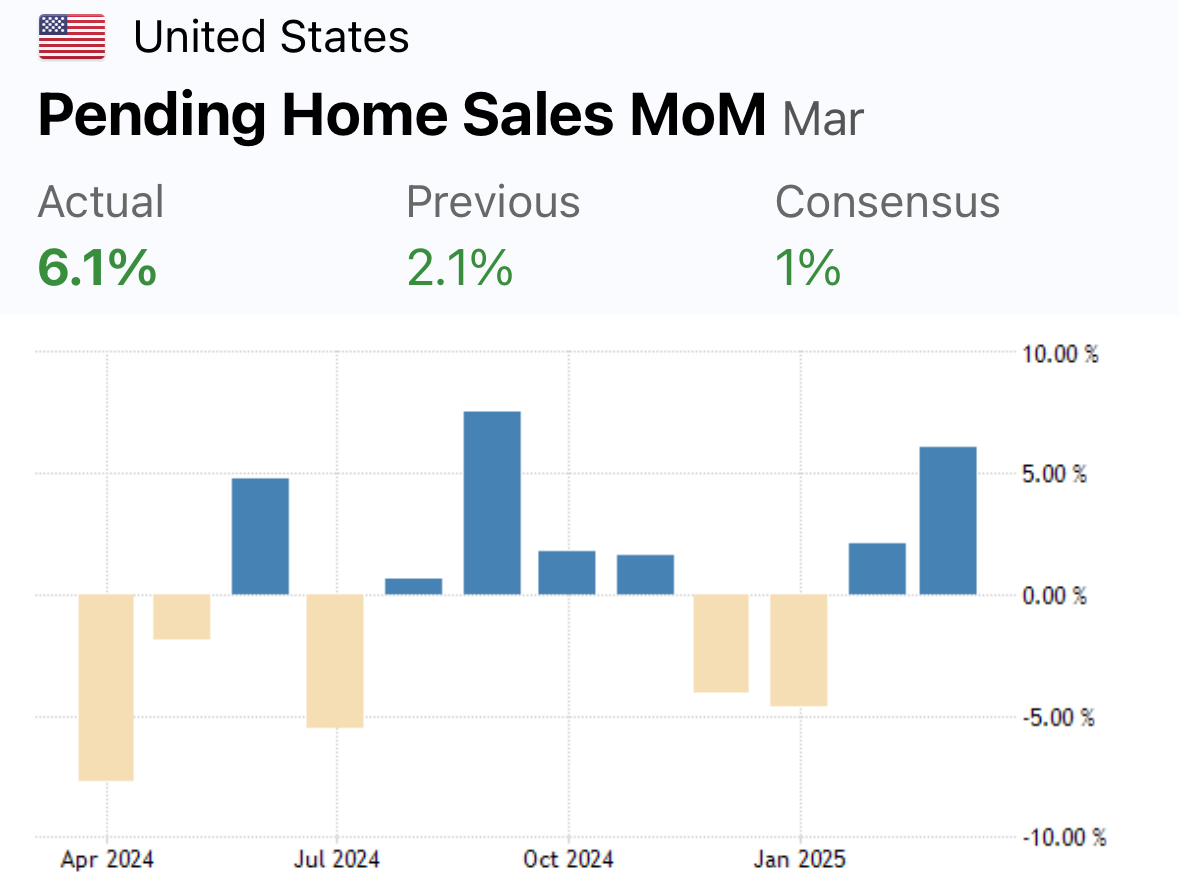
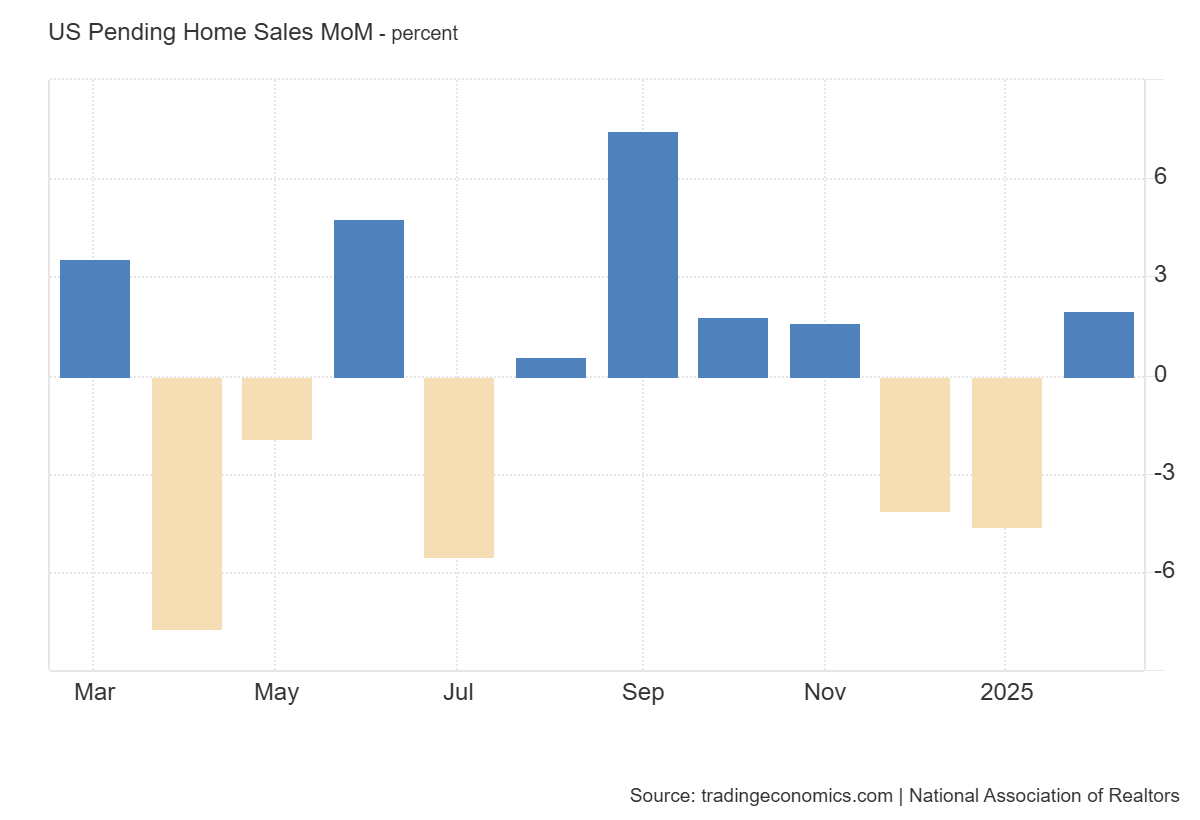
U.S. pending home sales declined -0.8% MoM and -0.4% YoY in January, signaling still-muted contract activity.
-
MoM: Midwest +5.0% and West +4.3% rose, while Northeast -5.7% and South -4.5% fell, showing mixed regional momentum within a small national decline.
-
YoY: South +4.0% and West +0.3% increased, but Northeast -8.3% and Midwest -3.3% declined, indicating uneven annual recovery across regions.
-
Mortgage rates near 6% newly qualify about 5.5M households, with roughly 10% potentially entering the market, suggesting gradual demand support rather than immediate buying.
-
Limited housing supply could push prices higher if new buyers become active, highlighting affordability pressures despite improving qualification conditions.
-
Largest metro YoY gains included Phoenix +11.8%, Boston +10.7%, and Charlotte +10.7%, showing localized strength despite soft national totals.
-
The Housing for the 21st Century Act passage signals policy efforts to expand supply and address housing shortages, tied to broader affordability trends.
-