US International Trade
- Source
- Bureau of Economic Analysis
- Source Link
- https://www.bea.gov/
- Frequency
- Monthly
- Next Release(s)
- January 29th, 2026 8:30 AM
-
February 5th, 2026 8:30 AM
-
March 5th, 2026 8:30 AM
-
April 2nd, 2026 8:30 AM
-
May 5th, 2026 8:30 AM
-
June 9th, 2026 8:30 AM
-
July 7th, 2026 8:30 AM
-
August 4th, 2026 8:30 AM
-
September 3rd, 2026 8:30 AM
-
October 6th, 2026 8:30 AM
-
November 4th, 2026 8:30 AM
-
December 8th, 2026 8:30 AM
Latest Updates
-
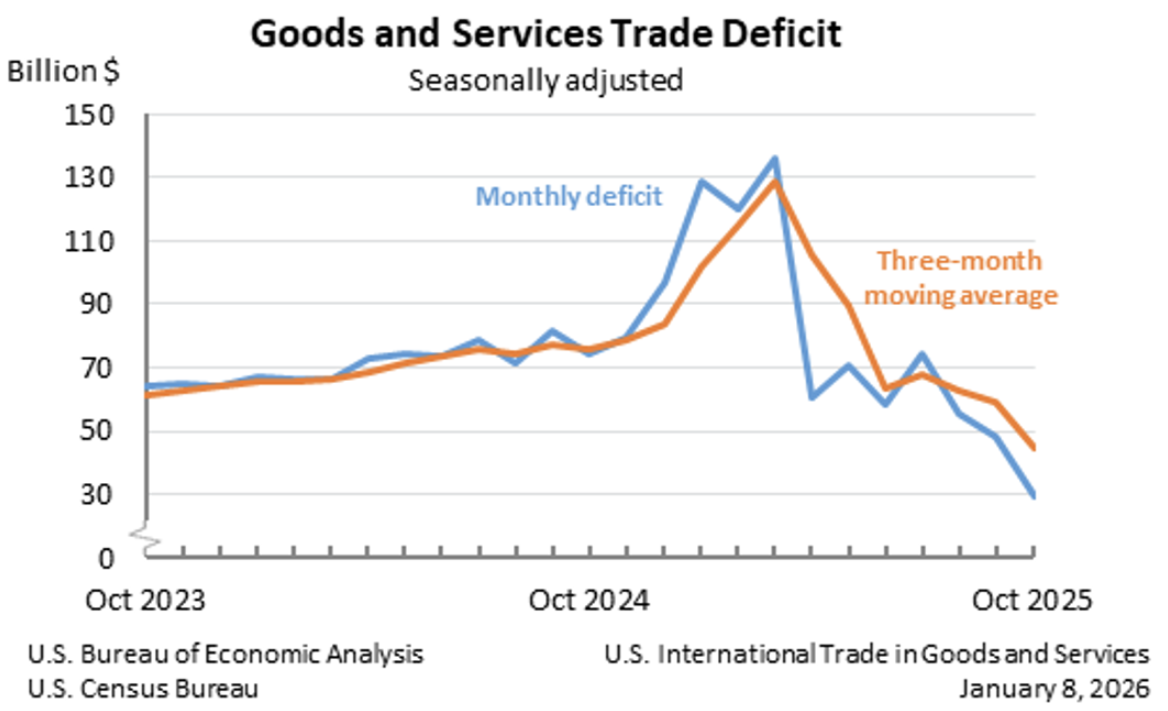
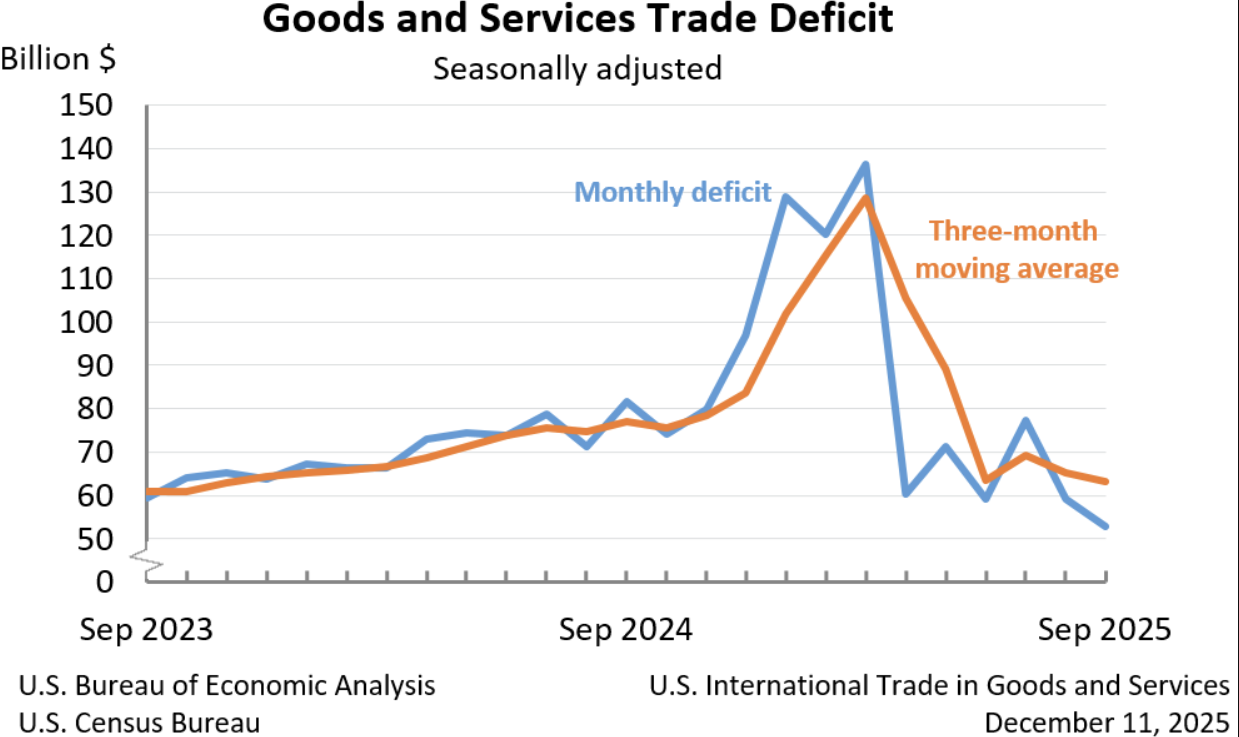
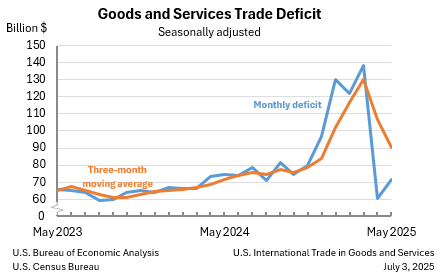
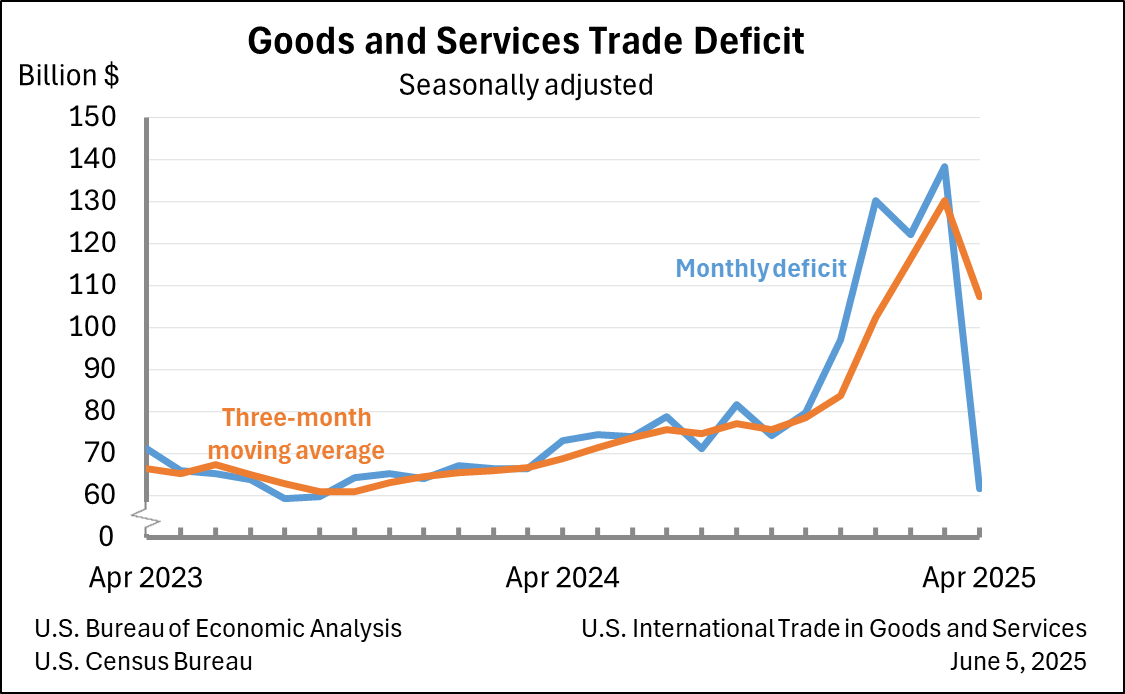
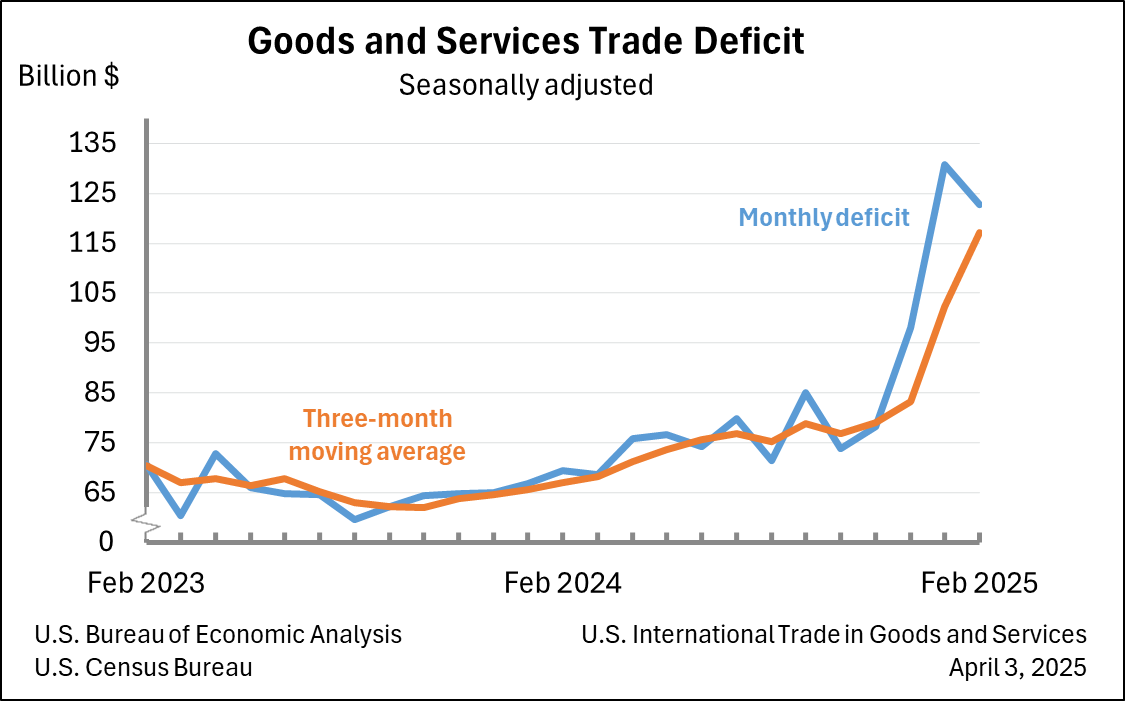
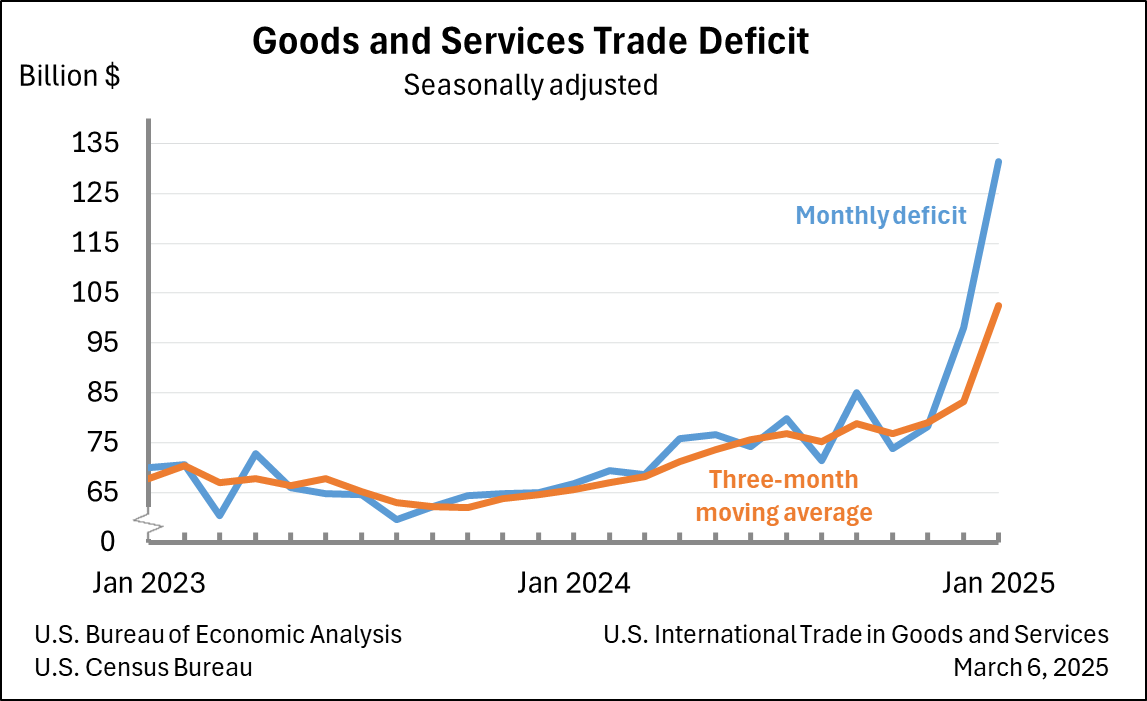
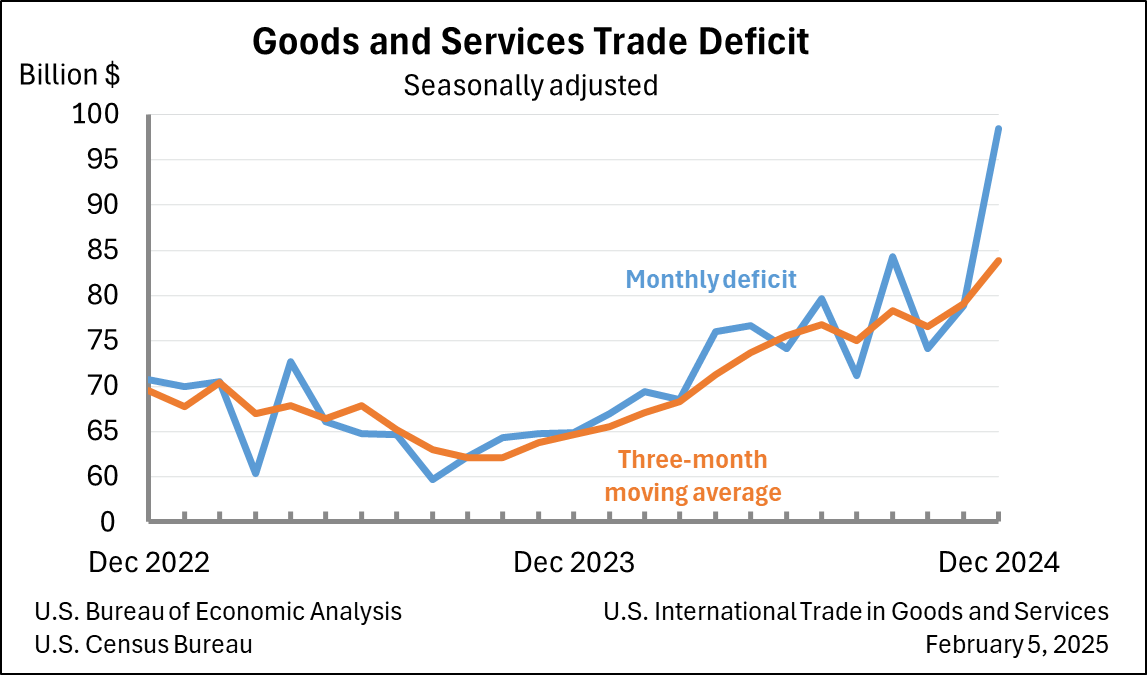
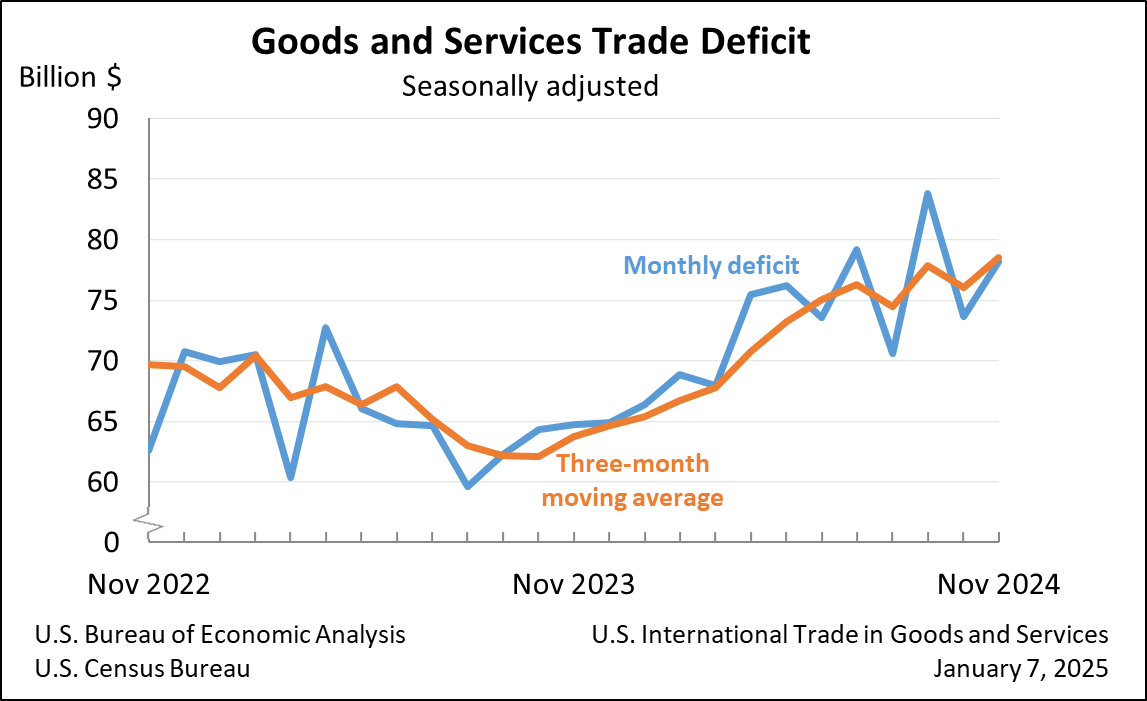
The U.S. goods and services trade deficit narrowed to $29.4B (vs $58.9 bil expected) in October (-39.0% MoM), the lowest since 2009 amid record exports and falling imports.
-
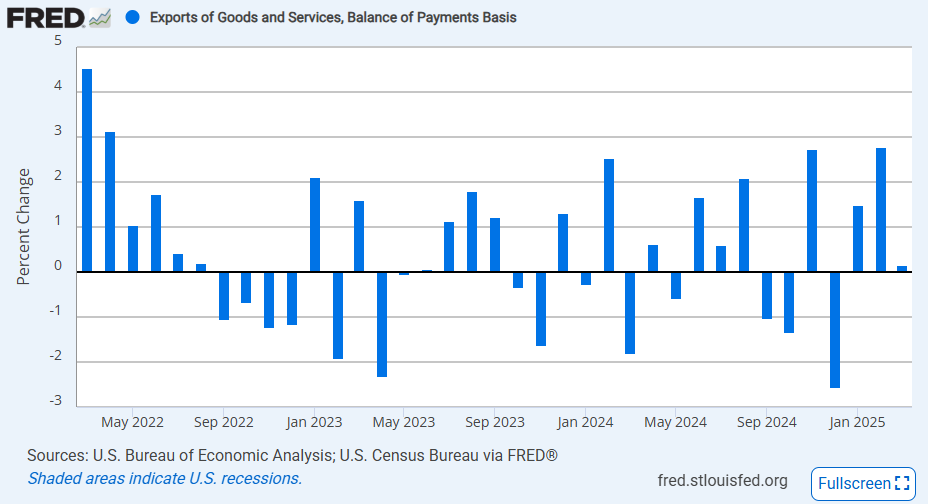
Exports rose to a record $302.0B (+$7.8B MoM; +2.6% MoM), driven by a $7.1B increase in goods exports to $195.9B and a $0.7B rise in services exports to a record $106.1B, indicating broad-based export strength.
-
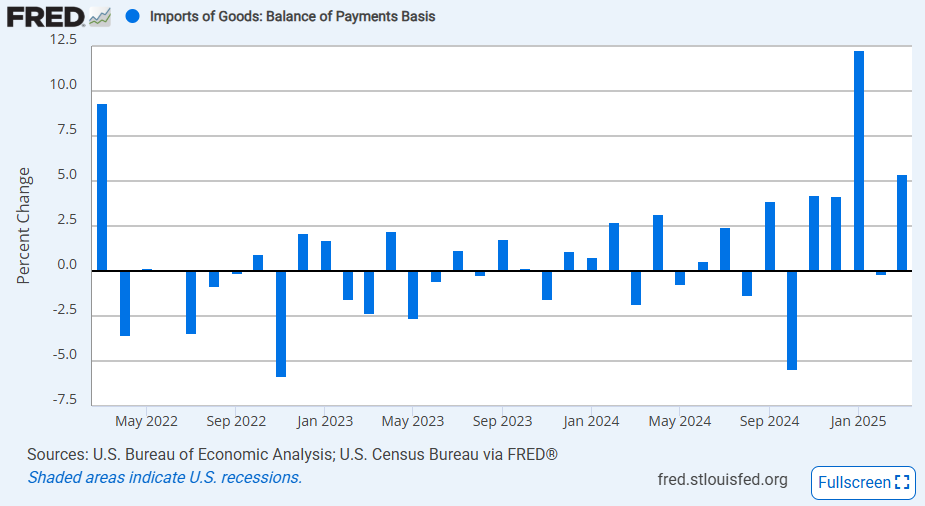
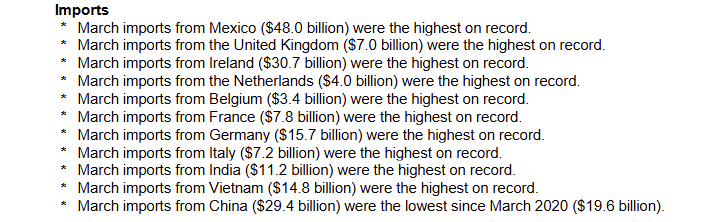
Imports declined to $331.4B (-$11.0B MoM; -3.2% MoM), with goods imports falling $12.1B to $255.0B, led by sharp declines in consumer goods (-$14.0B) and pharmaceuticals (-$14.3B).
-
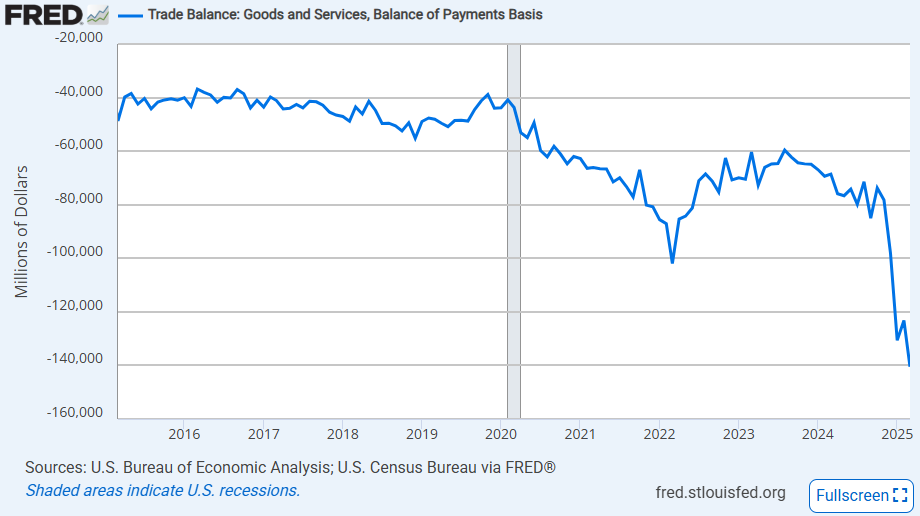
The goods deficit narrowed -$19.2B MoM to $59.1B, the lowest since March 2016, while the services surplus edged down -$0.4B to $29.8B, showing the improvement was concentrated in merchandise trade.
-
Year-to-date, the total trade deficit widened +$56.0B (+7.7% YoY), as imports (+6.6% YoY) continued to outpace exports (+6.3% YoY) despite October’s sharp monthly improvement.
-
The three-month average deficit fell to $44.4B (-$15.0B), with average exports up $6.0B and average imports down $9.0B, pointing to a sustained recent narrowing trend.
-
Real goods trade improved materially, with the real goods deficit shrinking -19.8% MoM to $63.1B; real exports rose +3.9% MoM while real imports fell -4.2% MoM, reinforcing the strength of volume-adjusted trade flows.
-
By partner, the deficit with Ireland narrowed sharply to $3.2B (-$15.1B MoM), while deficits widened with Taiwan (+$6.3B to $15.7B) and Mexico remained elevated at $17.9B, highlighting divergent bilateral trade dynamics.
-