US Industrial Production
- Source
- Federal Reserve
- Source Link
- https://www.federalreserve.gov/
- Frequency
- Monthly
- Next Release(s)
- March 16th, 2026 9:15 AM
-
April 16th, 2026 9:15 AM
-
May 15th, 2026 9:15 AM
-
June 15th, 2026 9:15 AM
-
July 17th, 2026 9:15 AM
-
August 18th, 2026 9:15 AM
-
September 16th, 2026 9:15 AM
-
October 16th, 2026 9:15 AM
-
November 17th, 2026 9:15 AM
-
December 16th, 2026 9:15 AM
Latest Updates
-
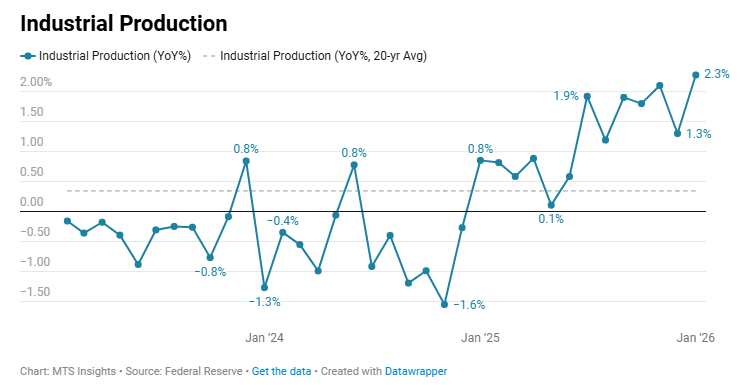
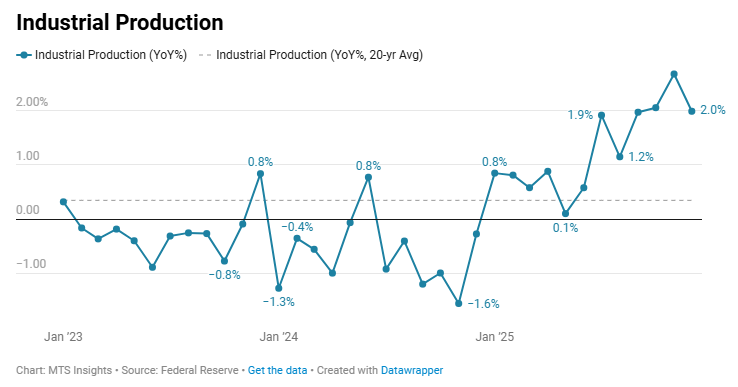
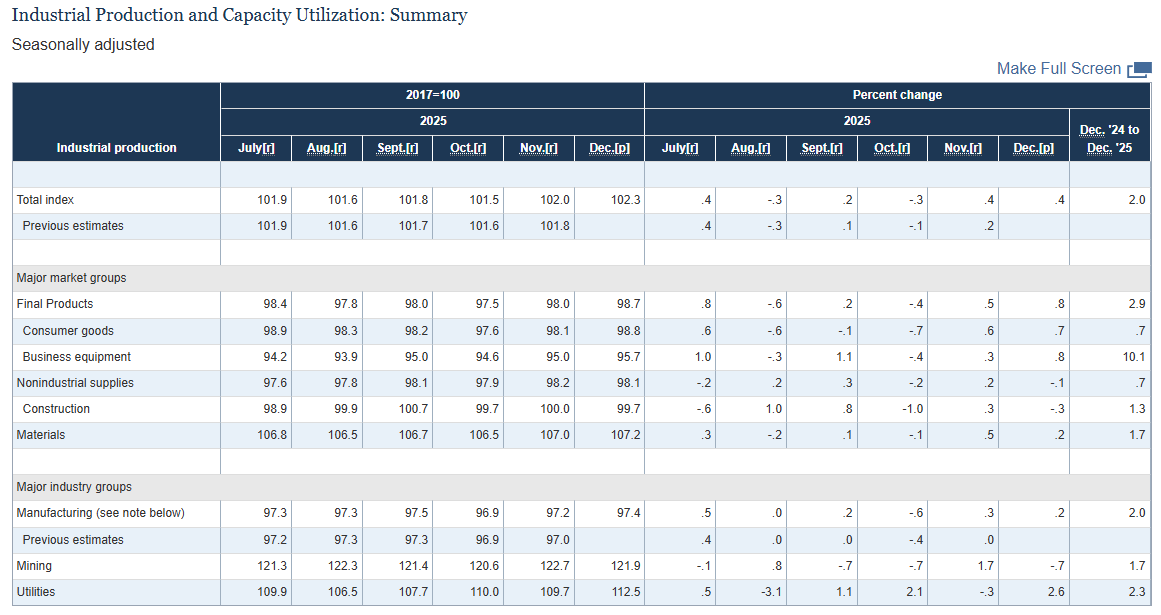
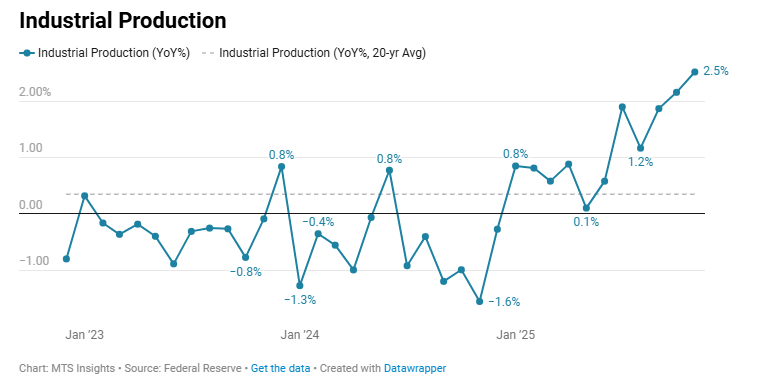
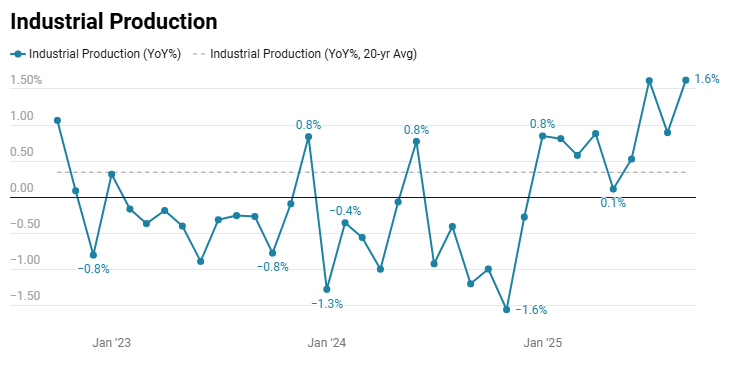
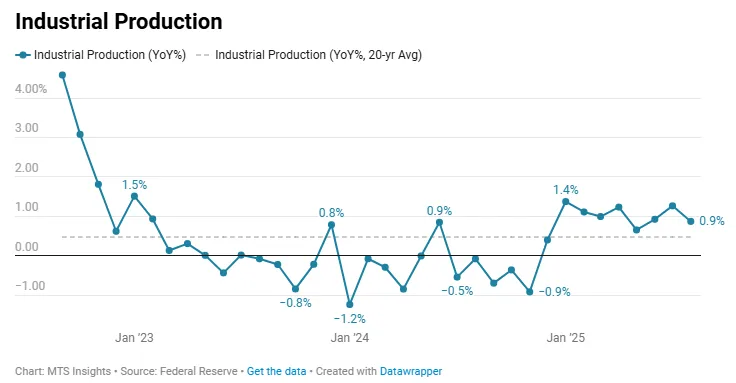
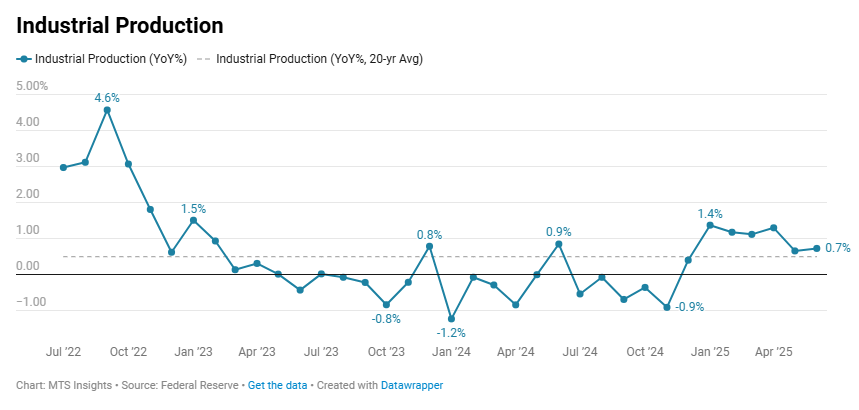
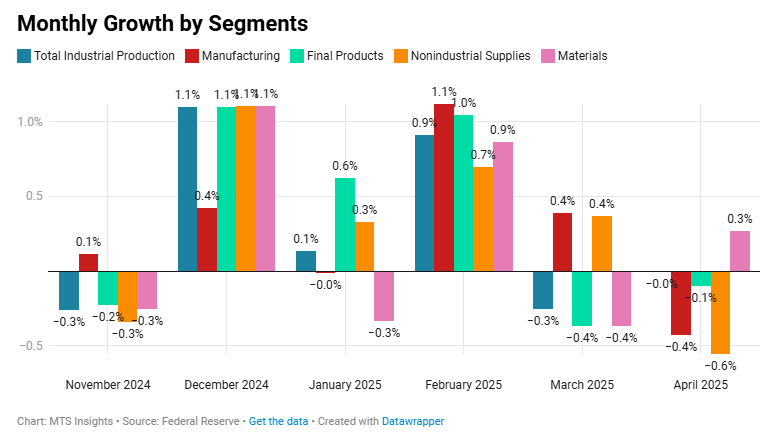
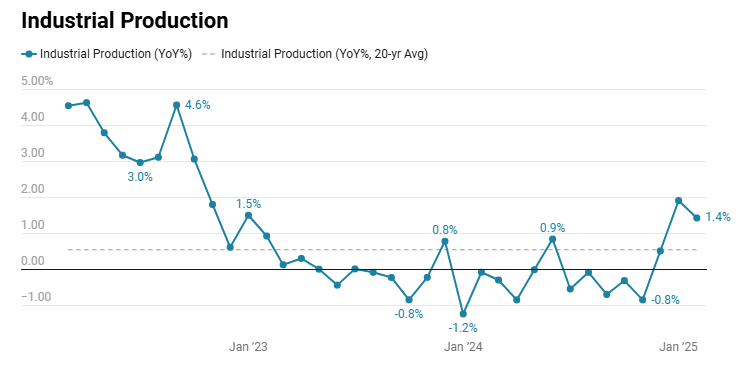
Industrial production rose +0.7% MoM (vs +0.4% MoM expected) and +2.3% YoY in January after +0.2% MoM (revised down from +0.4% MoM) in December, showing stronger start-of-year output growth.
-
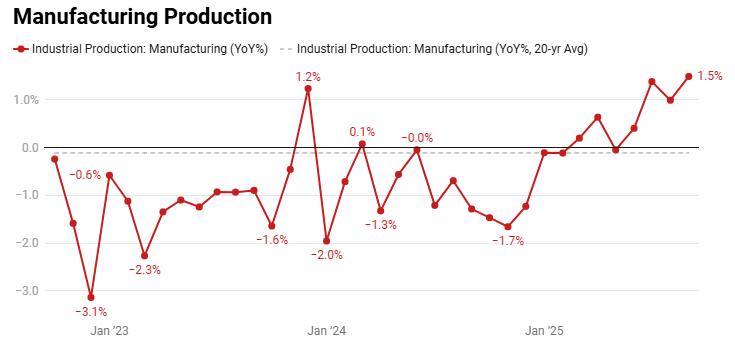
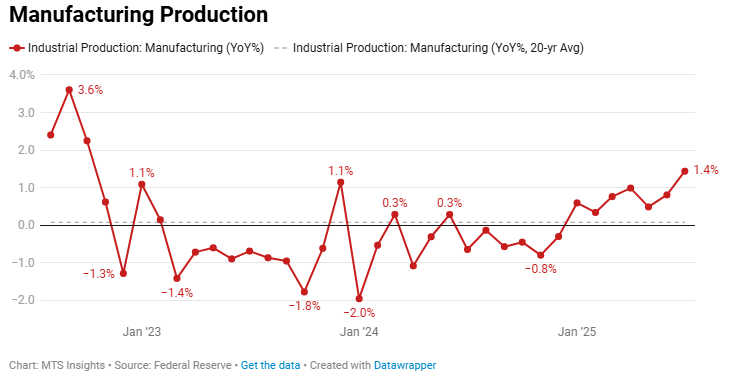
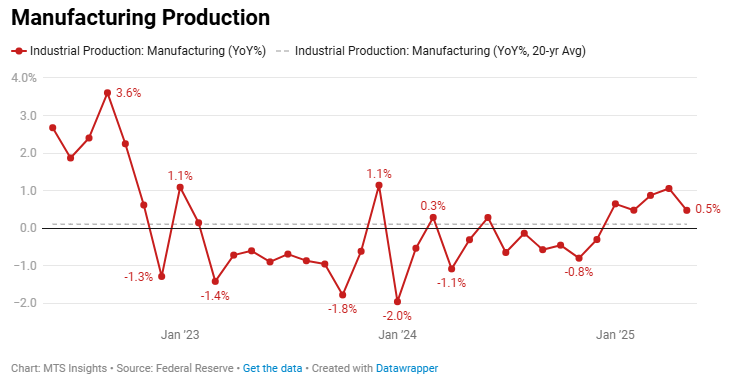
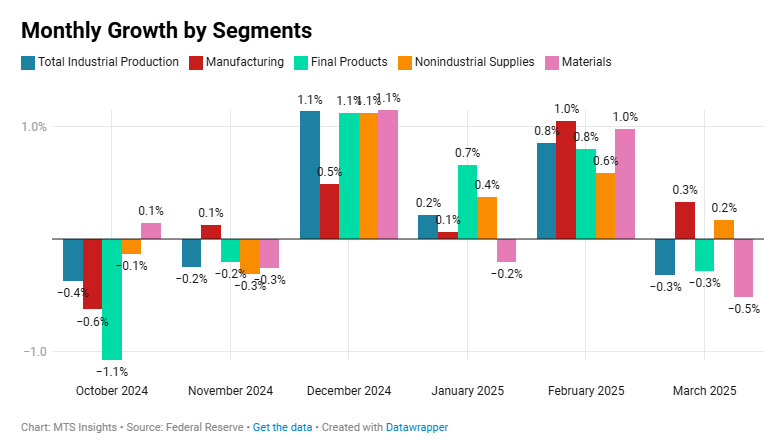
Manufacturing output increased +0.6% MoM (largest since Feb 2025), with durable goods +0.8% and nondurables +0.4%, indicating broad-based factory gains including the first rise in motor vehicles and parts since Aug 2025.
-
Mining output fell -0.2% MoM after -0.9% MoM in December, while utilities rose +2.1% MoM, showing strength concentrated outside the extraction sector.
-
Consumer goods output rose +0.7% MoM and business equipment +0.9% MoM, with gains across all equipment categories, pointing to widespread improvement across demand segments.
-
Materials output increased +0.6% MoM and nonindustrial supplies +0.9% MoM, reflecting positive contributions from business and construction supplies.
-
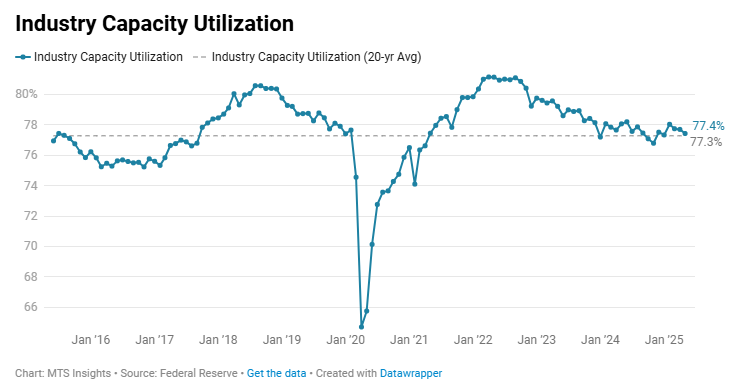
Capacity utilization rose to 76.2% (+0.4 ppt for manufacturing to 75.6%), remaining -3.2 ppts below the long-run average, indicating continued slack despite stronger production.
-
Mining utilization edged down to 84.4% and utilities rose to 72.9%, both still below long-run averages, suggesting operating rates remain subdued across sectors.
-
Industrial capacity is projected to rise +1.1% in 2026 (2025: +1.5%), with manufacturing capacity +1.0% and utilities +2.8%, pointing to moderate expansion in productive capacity.
-