
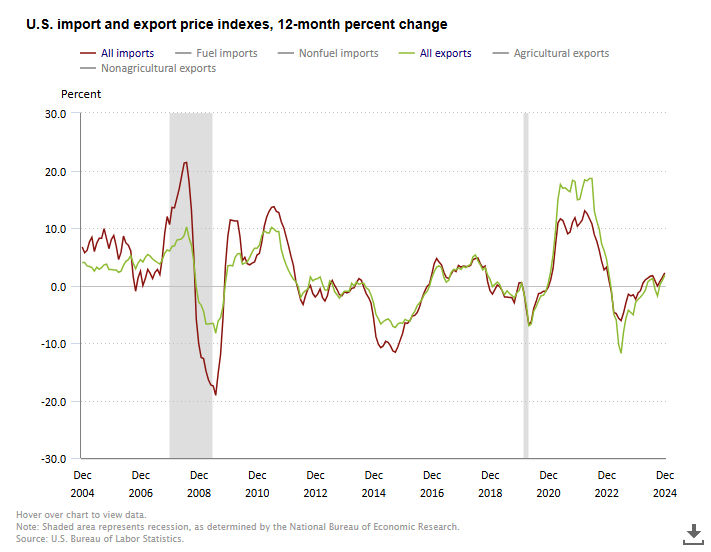
 US Trade Price Indexes
- Source
- BLS
- Source Link
- https://www.bls.gov/
- Frequency
- Monthly
- Next Release(s)
- September 16th, 2025 8:30 AM
Latest Updates
-
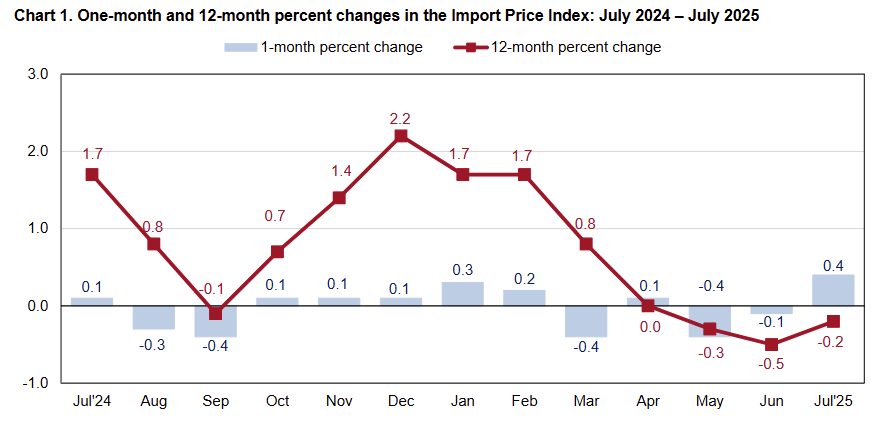
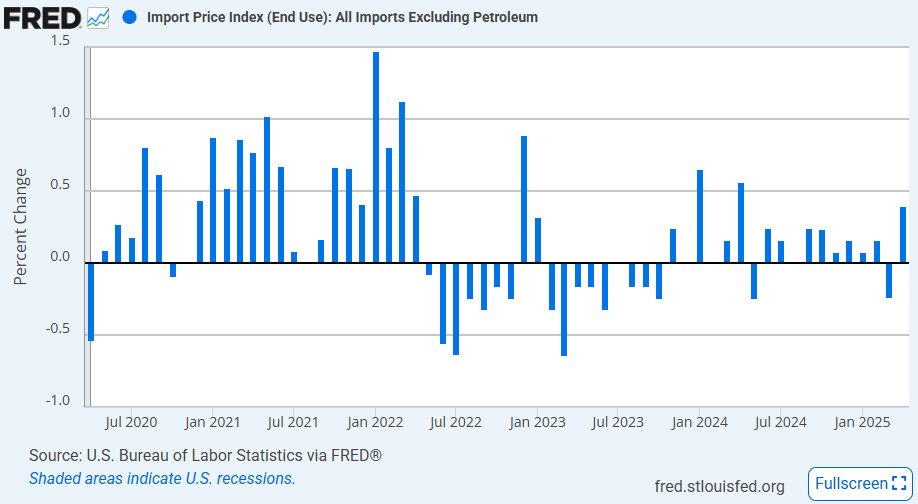
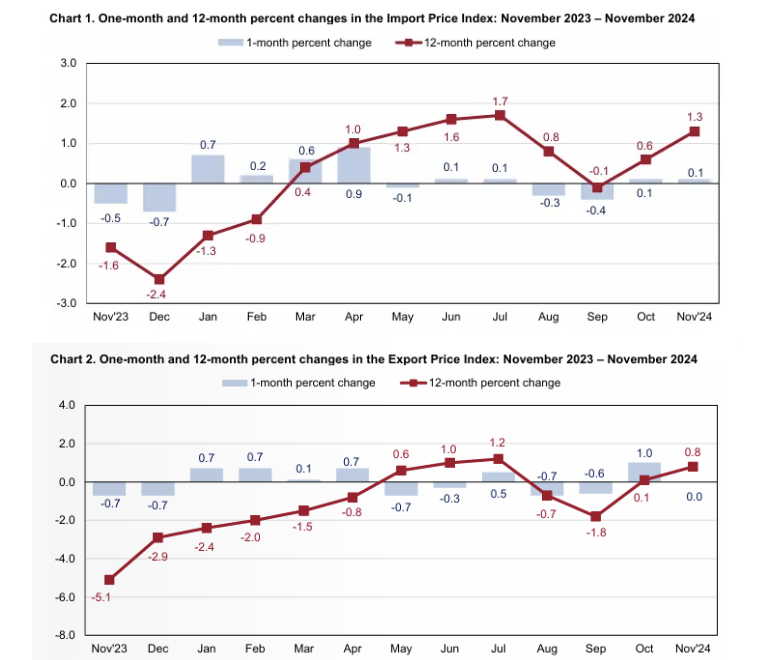
The BLS’ report on trade prices is the third report on prices this week. Like the PPI report, there appears to be some tariff-based inflationary pressure making an appearance. The import price index increased 0.4% MoM in July, an increase that was ahead of expectations of no growth and the largest since April 2024. Export price growth was in line with expectations, growing just 0.1% MoM in July. The focus will be on the import data which could be moving in response to tariffs (it is important to note that tariffs are not factored into import price calculations).
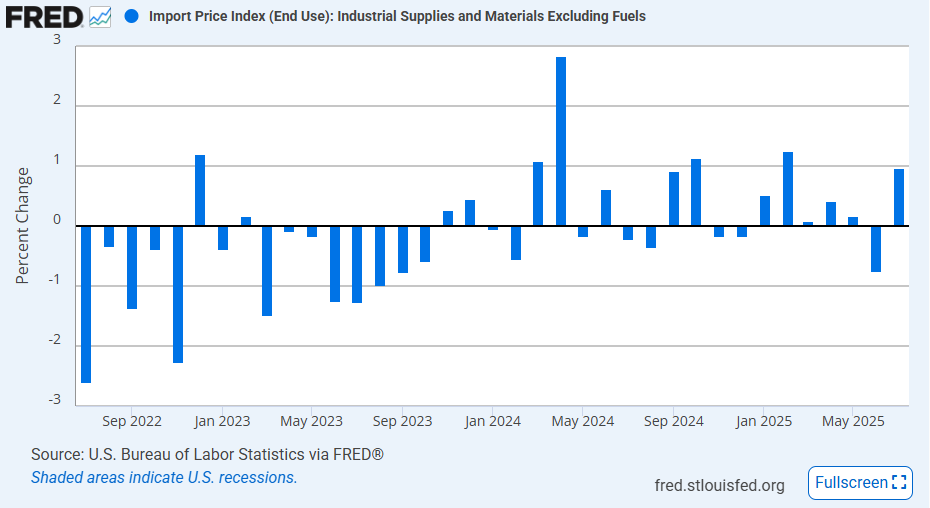
A large part of the increase in import prices came from fuel import prices, which were up 2.7% MoM, the largest increase since January. But that doesn’t take away from the largest nonfuel import price growth in over a year, coming in at 0.3% MoM. In particular, there was an increase in nonfuel industrial supplies & materials prices of 1.0% MoM, with durable supplies up 1.2% MoM and nondurable (ex petroleum) supplies up 1.5% MoM. On an annual basis, imported nonfuel industrial supplies prices were up just 2.8% YoY in June, but that accelerated to 4.1% YoY in July.
While import industrial supply prices were stronger, there was little evidence of inflation in other import price segments. The prices for imported food and beverages were down -0.1% MoM, and imported auto & parts prices were down -0.2% MoM. Capital goods import prices posted their third straight month of weak gains, up just 0.1% MoM. Consumer goods (ex-autos) import prices did see a slight tick up in growth to 0.4% MoM, with nondurables up 0.7% MoM, but this wasn’t a convincing increase that looked like tariffs.
-
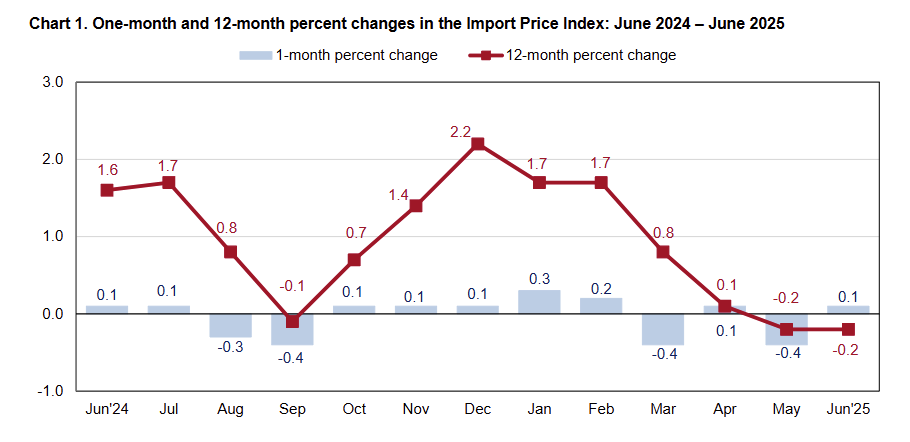
Import prices rose 0.1% MoM in June, below expectations of 0.3% MoM, while YoY growth remained steady at 1.2%. Fuel import prices fell -0.7% MoM and are down -15.7% YoY, continuing a four-month streak of declines.
- Nonfuel imports increased 0.1% MoM and 1.2% YoY, essentially unchanged from recent months.
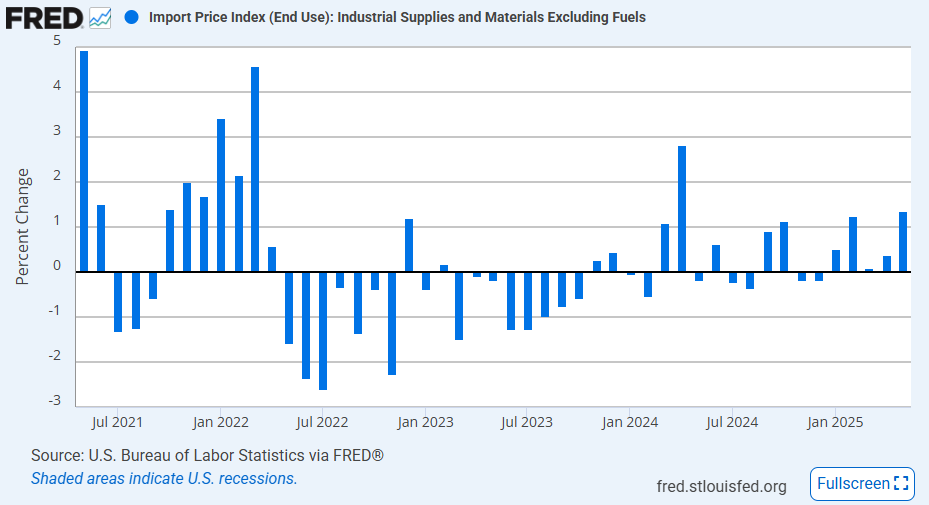
- Industrial supplies & materials ex-fuels rose 0.7% MoM, while inputs for durable goods jumped 1.2% MoM.
- These input segments have seen strong quarterly gains: 7.6% annualized in Q1 and 5.0% in Q2.
Export prices rose 0.5% MoM in June, a notable beat over expectations for no change, and were supported by broad strength across categories.
- Agricultural export prices rose 0.8% MoM, the largest gain since November 2024.
- Non-agricultural export prices also increased 0.5% MoM.
- Consumer goods export prices climbed 0.8% MoM, the biggest monthly rise since January 2023.
-
Like the CPI and PPI reports last week, the report on May trade prices this week does not reflect any major impacts from tariffs. Import prices were unchanged on a monthly basis and only up 0.2% YoY in May, better than the -0.2% MoM expected drop. Export prices actually dropped -0.9% MoM, well below the -0.2% MoM expected drop, but the annual rate was still up 1.7% YoY. While the headline indexes showed softness, there are some details worth noting within the import price indexes.
The import price index was heavily divided between fuel import prices which were down -4.0% MoM and -15.7% YoY, and nonfuel import prices which grew 0.3% MoM and 1.7% YoY. The nonfuel industrial supplies & materials index was especially hot with a 1.3% MoM, the 2nd highest MoM increase since March 2022. This included the third monthly increase over 1% in durable industrial supplies & materials in the last four months. These subindexes look like they could be heating up in response to tariffs and are being offset by weak energy import prices.
-
The US trade indexes both came in above expectations, posting slight gains over the estimates that suggested both import and export prices would fall in April. Durable goods segments were the key to the upside beats in both indexes as scramble to build inventories ahead of elevated tariff rates and potential retaliation drove trade inflation.
Import Prices
US import prices increased 0.1% MoM and 0.1% YoY in April, beating expectations of a -0.4% MoM decline. The forecast must have anticipated that the continued decline in energy import prices would overwhelm rising prices in other imports, but that wasn’t the case. Fuel imports did see another sharp decline last month, falling -2.6% MoM after the -3.4% MoM decline in March, but that was offset by a 0.4% MoM increase in nonfuel imports, the largest increase since a year ago and the 3rd largest since December 2022. The details in the nonfuel segment suggest tariffs played a role in increasing import prices:
- The overall industrial supplies import price index declined -0.5% MoM, but when stripping out fuels, the index actually jumped 0.8% MoM. This includes a 1.5% MoM increase in durable industrial supplies & materials. The largest increases were seen in nonmetals (+2.6% MoM) and finished metals (+2.4% MoM) related to durable goods, with the latter index up 12.7% YoY. Finished metal goods are one of the largest US imports from Canada, so the increase in the last three months there (averaging 1.8% MoM) is likely tariff-driven.
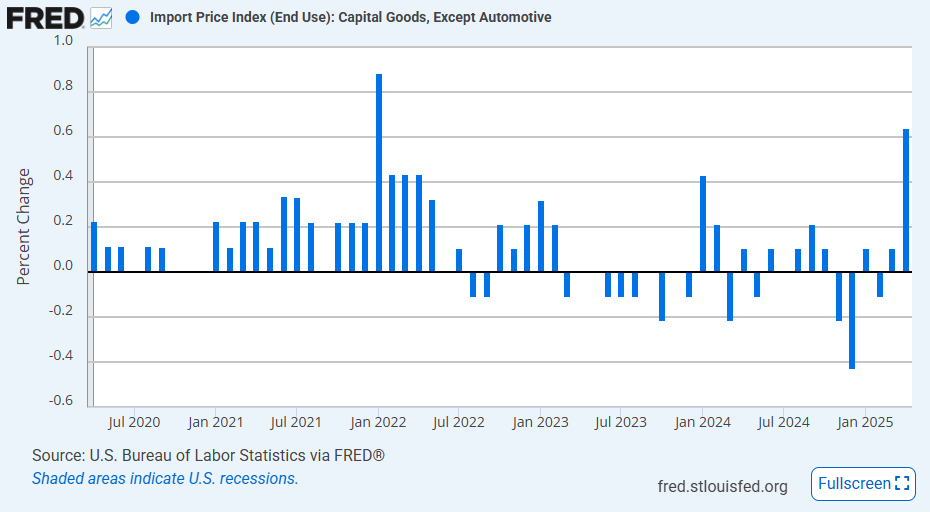
- The prices of various types of finished imported goods were also on the rise in April. Capital goods import prices increased 0.6% MoM, the largest monthly gain since January 2022, and consumer goods (ex-autos) import prices increased 0.3% MoM. Auto import prices ticked up 0.2% MoM, a sneaky six-month high. Within each type of good, the durables subsegments appear to be the hottest. Nonelectrical machinery, a capital goods subsegment that has a relative importance of over 22% and covers most capital goods, increased 0.6% MoM, the largest gain since January 2022.
- The cooler segments in import prices were energy, as mentioned above, and food & beverages, which saw no growth in April. Notable subsegments in these softer areas were imported natural gas prices (-17.5% MoM) and nonagricultural foods (-0.4% MoM).
While fuel import prices have kept the headline import price index in check, there was a noticeable trend of higher import prices for durable goods, which drove the beat over expectations in April. This includes sizeable increases in both the supplies to the US durable goods manufacturing sector and the imports of finished capital and consumer durable goods. While there are some signs of de-escalation by the Trump administration, effective tariff rates are still going to be higher than they were before his second term, so we should expect that import price gains in the medium-term (6-month, 12-month rates) will accelerate.
Export Prices
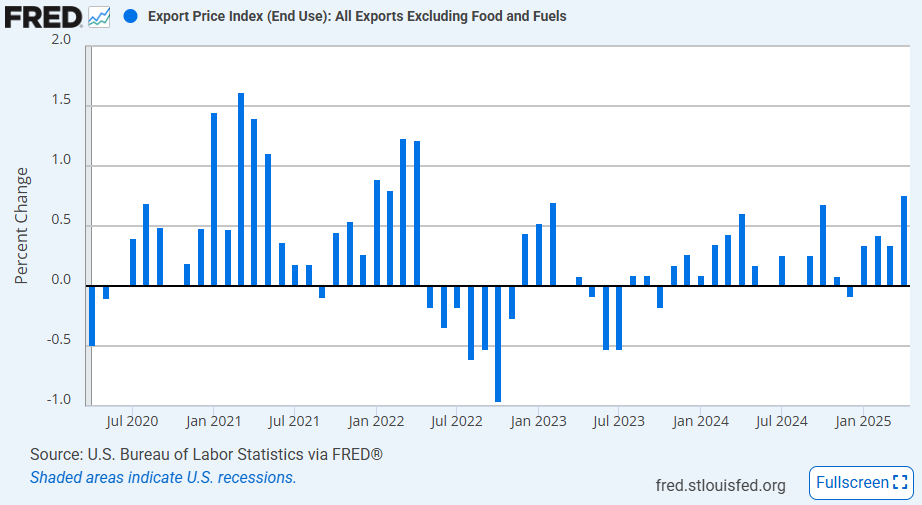
US export price growth in April also beat expectations, rising 0.1% MoM when a -0.5% MoM drop was expected. The increase was seen across both agricultural and non-agricultural exports, up 0.5% MoM and 0.1% MoM respectively. Just like in import prices, energy continues to have a noticeable impact as export prices actually increased 0.8% MoM if fuels and foods are excluded, the largest monthly increase for that segment in three years. Export prices were also similar to import prices in that durable goods segments were the hottest segments, offset by cooler readings in nondurables.
The durables segments that saw the largest increases in April had smaller weights in the headline index. The prices of industrial supplies & materials for durable goods jumped 2.9% MoM, the largest gain since March 2022, and were up 11.5% YoY. Export prices for finished durables like auto vehicles & parts and non-auto consumer durable goods increased 0.5% MoM and 0.8% MoM. Inflation in the prices of exports to the primary metal manufacturing industry was particularly hot, up 4.3% MoM and 25.7% YoY. Overall, the data support the narrative that other countries were front-running potential “Liberation Day” retaliation measures in April.
-
US import prices declined -0.1% MoM in March, marking the first monthly drop in six months as falling fuel costs pulled the headline index lower. The drop came in below expectations for a flat reading, while the YoY rate cooled to just 0.9%—the slowest pace since October 2024. Meanwhile, export prices were flat on the month but maintained a firmer YoY gain of 2.4%, supported by continued strength in nonfuel industrial supplies. While headline figures suggest a cooling in price pressures, the underlying details point to diverging trends across sectors, shaped by both energy market softness and trade dynamics defined by volatile tariff policy.
Import Prices
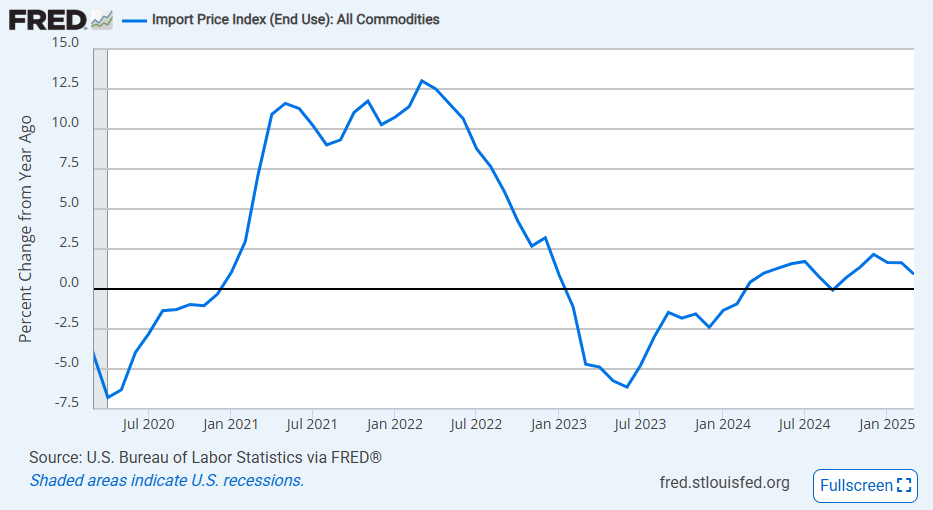
US import prices fell -0.1% MoM in March, below expectations of them remaining unchanged on a monthly basis. This was the first monthly decline in six months as weak energy prices caused the headline index to decline. On an annual basis, import prices advanced just 0.9% YoY, the lowest since October 2024. Again, energy played a major role in that trend as those prices flared up in Q4 2024 and caused a rebound in the YoY rate to 2.2% in December 2024. The details present a more mixed picture:
- Fuel imports fell -2.3% MoM in March, the largest decline since September 2024, and were down -5.2% YoY. The largest decline within this index was natural gas, down -19.8% MoM and other coal & gas fuel, down -15.8% MoM. Oil and oil products, the fuel subindexes with much larger weights, also contributed to the decline, down -1.4% MoM and -1.5% MoM respectively.
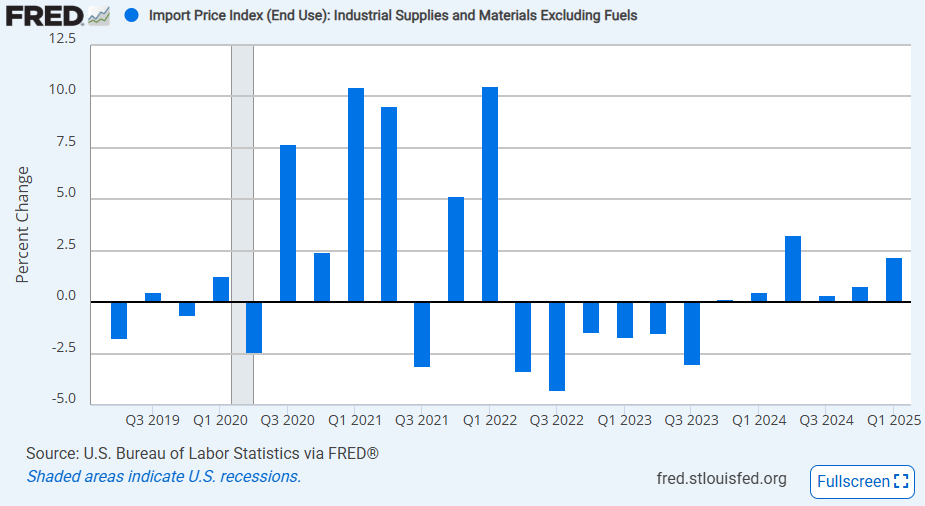
- When excluding fuels, industrial supplies and materials import prices increased 0.4% MoM in March driven by import prices of supplies for durables (+0.8% MoM) rising faster than prices of nonfuel supplies for nondurables (-0.2% MoM). Notably, this aggregate increased 2.2% QoQ in Q1 2025, the second highest quarterly rate since Q1 2022, and is up 6.7% YoY. Specifically in the March data, there were strong increases in unfinished and finished metals related to durable goods, up 1.4% MoM and 1.3% MoM respectively.
- Capital goods and auto vehicle & parts import prices were muted in March as the former increased 0.3% MoM and the latter was down -0.1% MoM for the fourth straight month. These indexes have been subdued throughout the first quarter with the exception of the small “transport equipment ex motor vehicles” index which grew 1.2% MoM in March and 1.0% MoM in January.
- Imports of consumer goods (ex-autos) continued to be in a deflationary trend, falling for the fifth straight month, down -0.2% MoM. This was seen across durables and nondurables consumer goods import prices, both down -0.2% MoM as well.
Export Prices
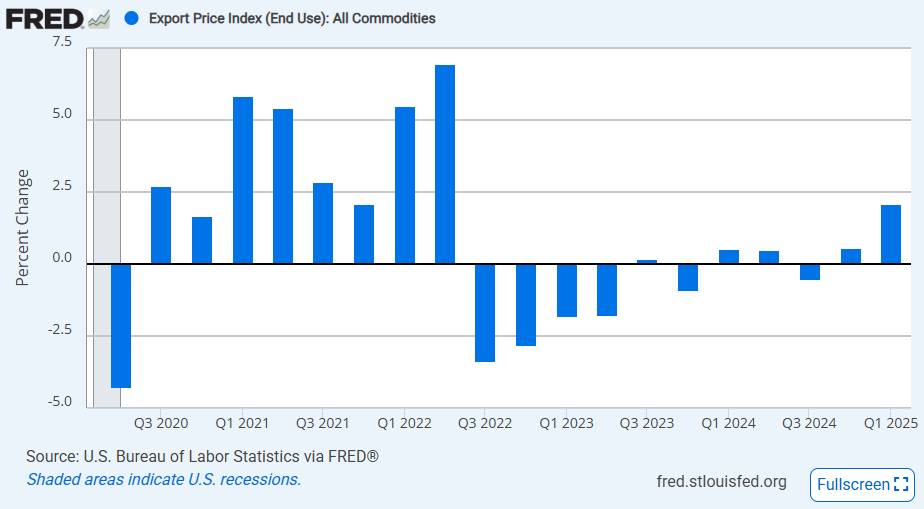
US export prices were also cool in March as they saw no change over the month, in line with what analysts expected. On an annual basis, export prices are up 2.4% YoY, the fourth consecutive month of the annual growth of export prices above 2%. The strong gains in January and February mean that export prices have grown 2.1% QoQ in Q1 2025, the strongest growth since Q2 2022. So even though March was a relatively cool report for export prices, there is a clear upward trend that has developed.
- Agricultural exports were unchanged in March after growth of 0.6% MoM in February. The segment is only up 1.4% YoY. Prices for US agricultural products might continue to be weak if China maintains its tariff rates on US agricultural imports. China has already made it a goal to be less reliant on US food exports, and this trade war might accelerate that timeline.
- As energy prices have fallen across markets, so have US fuel export prices. They fell -2.0% MoM in March, the largest decline since September 2024, and the annual rate has fallen to -2.4% YoY.
- Excluding food and fuels, export prices were up 0.4% MoM, another moderately strong increase that rounded out a strong Q1 2025. Within this index, nonfuel industrial supplies & materials increased 0.6% MoM with the durable subsegment increased 0.8% MoM. On an annual basis, nonfuel industrial supplies & materials export prices are up 11.1% YoY. Capital goods (+0.5% MoM) and consumer goods (+0.3% MoM) export prices saw more moderate increases.
Mexico and Canada Import Prices
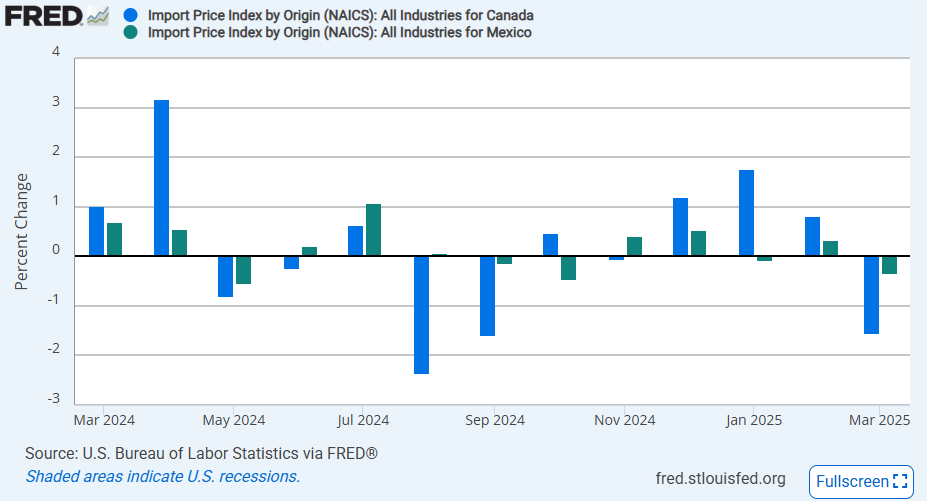
The trends in prices for Canadian and Mexican imports reflected a slowdown in trade between the US and its two North American neighbors after tariff front-running caused a flare up in February. The index tracking imports from Canada fell -1.5% MoM in March after growing 1.8% MoM in January and 0.8% MoM in February. Nonmanufacturing Canadian import prices saw the most volatility in that period, growing 5.8% MoM and 2.8% MoM in January and February before dropping -3.2% MoM in March. The trend was similar in Mexican imports. The all Mexican import price index fell -0.3% MoM in March after a gain of 0.3% MoM in February with nonmanufacturing imports down -2.1% MoM in March after a 0.6% MoM gain in February.
While some of the decline in March can be attributed to weak energy prices, it is hard to deny that there is a clear trend of import activity grinding to a halt at the end of Q1 2025 as tariffs were put in place at the beginning of March. However, importers have only built inventories for a certain period, however, and that activity will have to return to normal. If these tariffs remain in place, import prices might start to recover and move much higher as the costs of the import duties are spread out along the supply chain.
-
Indicator February Forecast Previous Import Prices (MoM) 0.4% -0.1% 0.1% Import Prices (YoY) 2.0% 1.6% 1.9% Export Prices (MoM) 0.1% -0.2% 1.3% Export Prices (YoY) 2.1% - 2.7% 
Both import and export prices were higher than expected in February by a substantial margin. Forecasts had both indexes falling on a monthly basis, but the BLS’ report estimated that import prices were up by 0.4% MoM and export prices were up by 0.1% MoM. The annual growth rates of both indexes are now around 2% when a year ago they were both negative. The impact of tariffs was only largely seen in China, though notable increases in Canadian and Mexican export prices may have been caused by tariff front-running.
Import Prices
In a month that was filled with tariff threats, it is not a major surprise that import costs were on the rise. Import prices increased 0.4% MoM for the second straight month, pushing the annual rate up to 2.0%. Fuel import prices were a major component of that increase, rising 1.7% MoM, The strongest rise was in gas import costs where natural gas import prices were up 14.0% MoM and 49.9% YoY and other coal & gas fuel prices were up 6.0% MoM and 25.9% YoY. Crude oil import prices saw a smaller increase of 1.9% YoY. Fuels alone account for about 8.6% of the overall import price index.
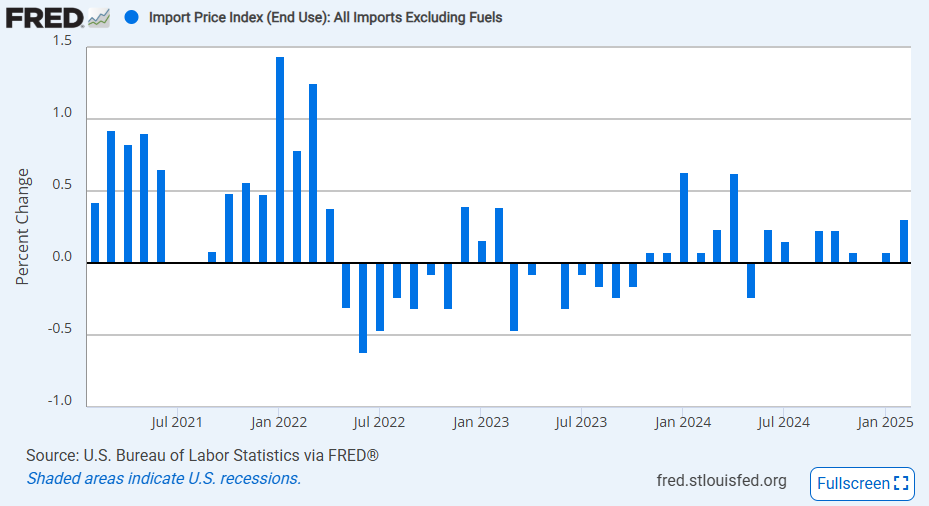
Imports excluding fuels were still up, rising 0.3% MoM, meaning that even if that volatile component was removed, import prices would have beaten the forecast for February. The monthly rate for this aggregate was the highest since April 2024. Here are the notable moves in nonfuel categories:
- When excluding fuels from the industrial supplies category, the index was still up a strong 1.8% MoM and 8.0% YoY. This is the largest annual increase since August 2022, a month from the period defined by post-COVID supply chain pressures. Both durable and nondurable industrial supplies saw a strong increase with a notable rise of 3.8% MoM in finished metals related to durable goods.
- The price index for imported consumer goods, not including autos, advanced 0.4% MoM in February, the largest monthly increase in a year. Price pressures were spread pretty evenly with the largest increase in manufactured durables import prices (+0.5% MoM).
- The categories for capital goods and auto vehicles & parts, which together account for about 44% of the import price index, were the coolest in February, down -0.2% MoM and unchanged MoM respectively. The capital goods index has been cool for some time, down -0.4% YoY while auto import price growth has moderated to 1.4% YoY.
Export Prices
Export price growth was forecasted to contract by -0.2% MoM in February, but it actually managed to notch a slight increase of 0.1% MoM, keeping the annual rate above two percent at 2.1% YoY. Agricultural export prices pushed overall export prices higher, rising 0.8% MoM after a decline in January, and they were offset by a decline in fuel export prices of -0.4% MoM. Notably, agricultural export prices were up 0.6% YoY, the highest in two years. Excluding both these indexes, export prices were up 0.2% MoM with nonfuel segments moving about the same across the board.
- The segments seeing little to no growth were nonfuel industrial supplies (0.0% MoM), capital goods (+0.1% MoM), and auto vehicles & parts (+0.2% MoM).
- Consumer goods (ex autos) exports was the only segment with a moderate increase, up 0.6% MoM.
- Outside of goods exports, the export air passenger fares index decreased -13.0% MoM in February, after advancing 12.8% MoM in January. The February drop was the largest monthly decline since February 2023.
Trade Prices by Locality
In the coming months, data on trade prices by locality will become a new focus as the Trump administration continues to push its tariff policies forward. February’s trade prices were likely not impacted directly by tariffs since there was an immediate delay of the duties put in place on February 1st, but rising uncertainty in North American supply chains could have played a role.
- Canadian import prices increased 0.8% MoM in February likely caused by a rise in fuel import prices (all fuel import prices were up 1.7% MoM). Manufacturing imports were up 0.1% MoM suggesting not much of a disruption there. While import prices were not much of a surprise, the rise in the prices of exports to Canada was the largest since March 2022, up 2.0% MoM in February. This flare up suggests that costs increased as Canadian firms looked to front run Canada’s retaliatory tariffs causing a spike in demand.
- Mexican import and export prices saw a similar trend. Mexican import prices were up 0.2% MoM, similar to where prices have been trending for the last few months. Prices of exports to Mexico saw a larger increase of 0.9% MoM, building on the 1.6% MoM increase in January. This includes a second straight 0.9% MoM increase in export prices of manufacturing goods which could also be an indicator of front running Mexico’s impending retaliatory tariffs.
- The one country that did face tariffs from the US in February was China, and there was some significant movement in import prices there. Prices for imports from China rose 0.5% MoM in February, after rising 0.2% MoM in January. The February advance was the largest 1-month increase since March 2022. Chinese import prices are now up 0.5% YoY, the first increase since December 2022. On the other hand, US export prices to China were unchanged in February.
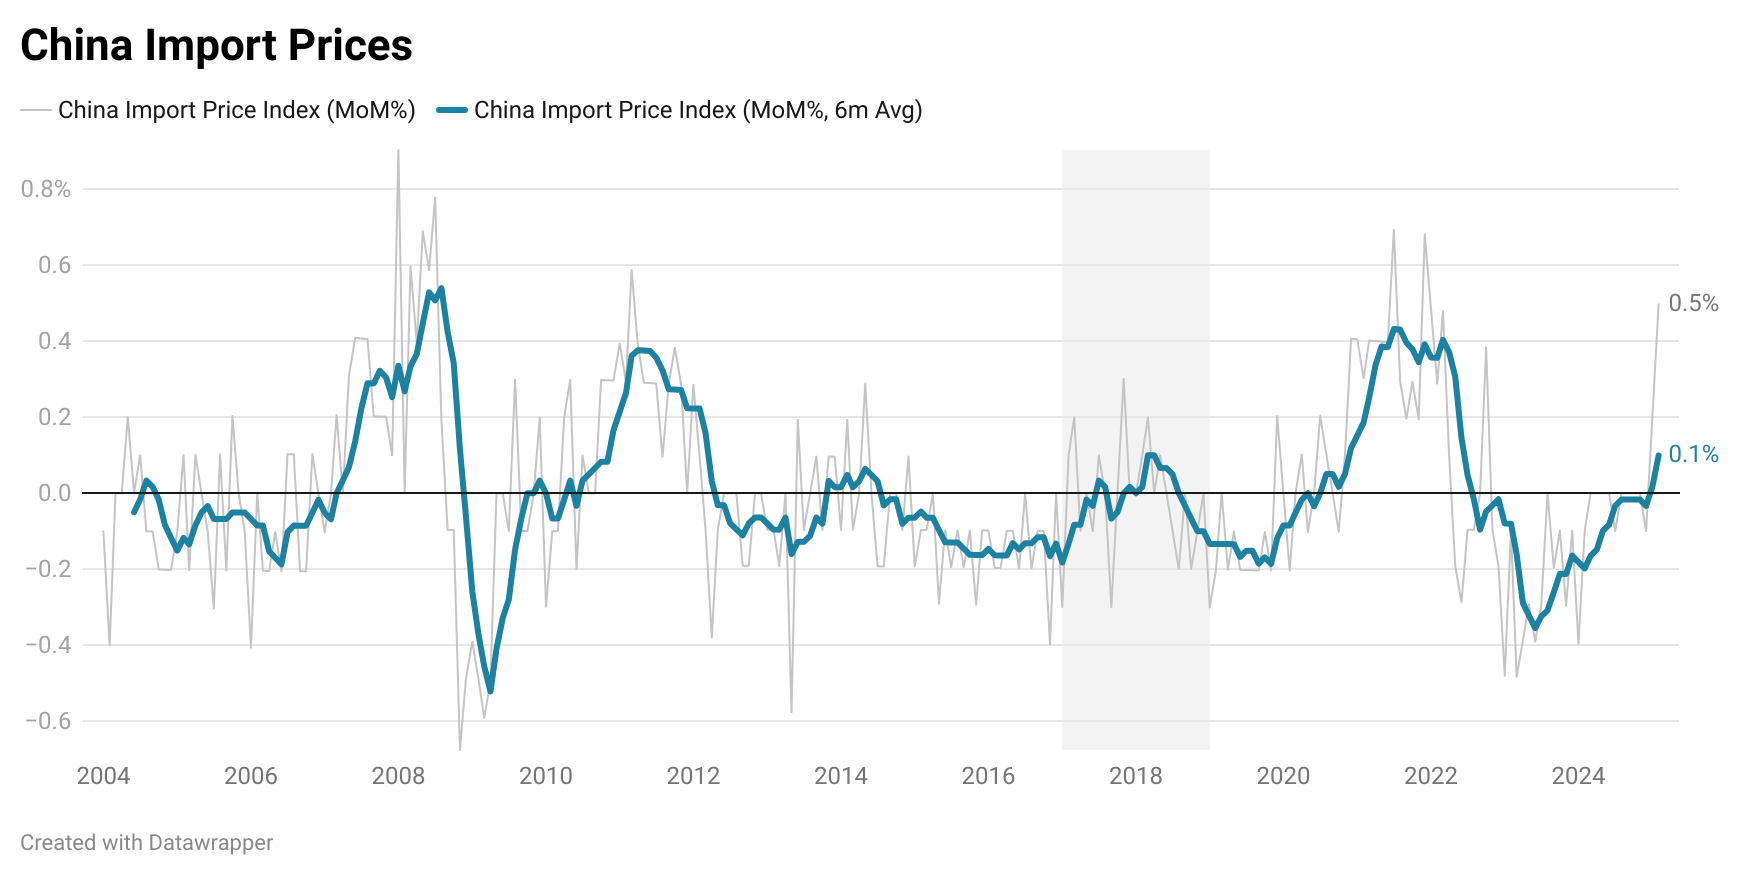
During Trump’s first term, the US did have a period of volatile trade policy specifically in regards to China. The measures put in place were slightly more targeted and less harsh, but they did appear to coincide with a rise in import Chinese import prices. In 2017 and 2018, the 6-month average of monthly increases in Chinese import prices flipped from negative to positive and reached about 0.2% at its peak before Chinese import prices started falling again in 2019. In February, the 0.5% MoM increase is more than we saw in any month in Trump’s first term, and the hot reading has pushed the 6-month average up to 0.1% already.
Next month’s data for March will be even more interesting as we will see more direct effects of the tariffs that have gone into place. Both the US tariffs and the retaliatory tariffs from Canada, Mexico, and China will have an impact on both import and export prices as firms try to sort out how to pass these new costs along the supply chain. As tariffs broaden out to include the EU and, potentially, the entire world, an increase in trade costs will put significant pressure on firms’ profit margins, especially those who rely on foreign supply chains and revenues.
-
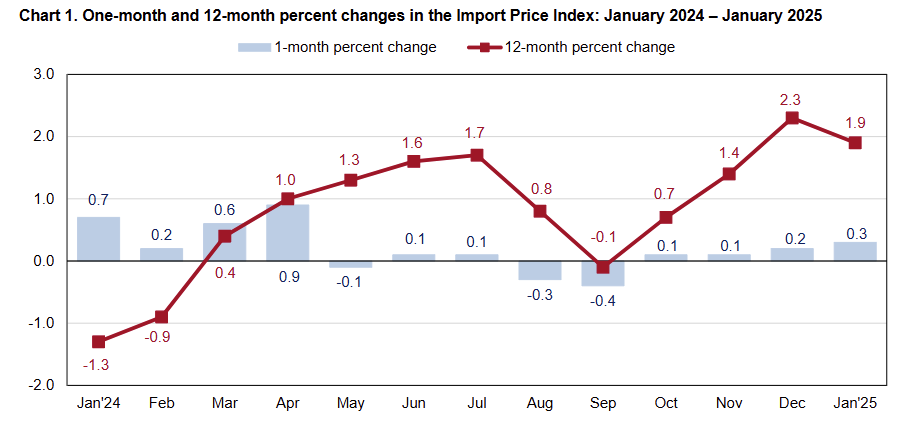
Import prices were up 0.3% MoM and 1.9% YoY in January, slightly below expectations of an 0.4% MoM increase.
- Fuel imports jumped 3.2% MoM, the largest monthly gain since April 2024, and the annual rate is now up to 1.9% YoY.
- Nonfuel imports increased 0.1% MoM for the third straight month and were up 1.8% YoY.
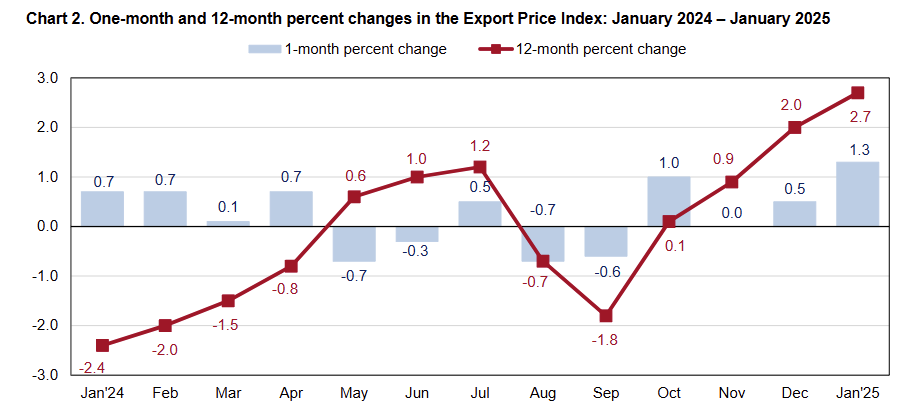
Export prices jumped 1.3% MoM, a huge beat over 0.3% MoM expected, and were up 2.7% YoY, accelerating from 2.0% YoY previously.
- Agricultural exports actually fell -0.2% MoM and were only up 0.5% YoY.
- All of the increase came from non-agricultural export prices, up 1.5% YoY, as the price of fuel exports jumped 7.0% MoM.
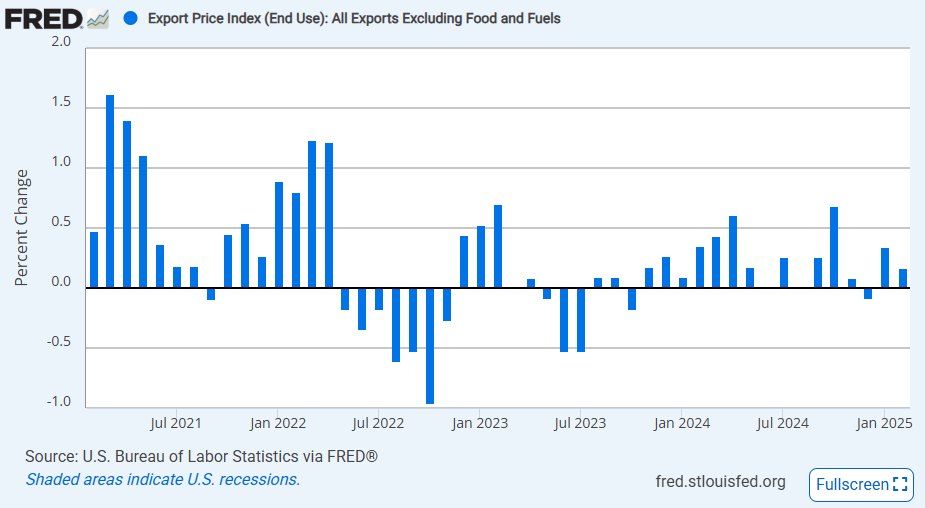
- The January increase in nonagricultural industrial supplies and materials prices of 3.5% MoM was the largest 1-month increase since August 2023.
-
US import prices edged up 0.1% MoM for the third straight month in December, in line with expectations, and export prices grew 0.3% MoM, above the 0.2% MoM projection. The annual rate of import price inflation was 2.2% YoY, the highest since December 2022. Fuel imports jumped 1.4% MoM, the largest increase since April, and nonfuel imports were up just 0.1% MoM. Agricultural exports increased 0.5% MoM, and non-agricultural exports grew 0.3% YoY.
-
Import prices increased 0.1% MoM (vs -0.2% MoM expected), and export prices saw no change (vs -0.2% MoM expected) in November. On an annual basis, import prices were up 1.3% YoY and export prices up 0.8% YoY. Nonfuel import prices were flat as energy import prices were up 1.0% MoM, the first monthly increase since May.