
 US GDP
- Source
- Bureau of Economic Analysis
- Source Link
- https://www.bea.gov/
- Frequency
- Quarterly
- Next Release(s)
- April 9th, 2026 8:30 AM
-
April 30th, 2026 8:30 AM
-
May 28th, 2026 8:30 AM
-
June 25th, 2026 8:30 AM
-
July 30th, 2026 8:30 AM
-
August 26th, 2026 8:30 AM
-
September 30th, 2026 8:30 AM
-
October 29th, 2026 8:30 AM
-
November 25th, 2026 8:30 AM
-
December 23rd, 2026 8:30 AM
Latest Updates
-
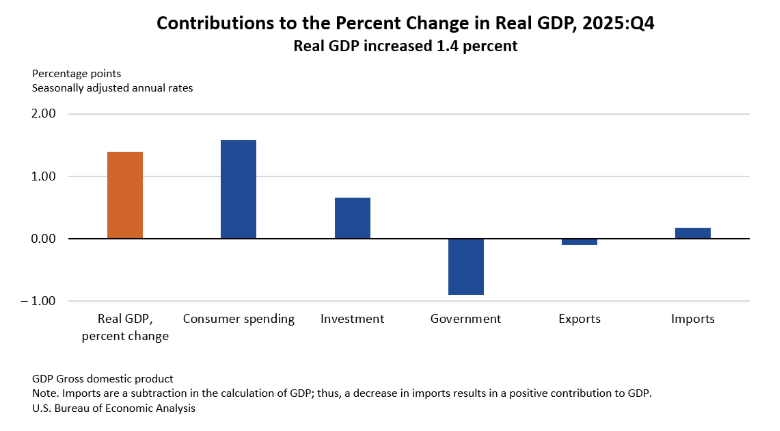
U.S. real GDP rose +1.4% SAAR (vs +3.0% expected) in Q4 2025, well below ~3% forecasts amid shutdown distortion.
-
Consumer spending increased +2.4% SAAR (slower than prior two quarters), with goods -0.1% SAAR driven by nondurables -0.9% and services +3.4% SAAR; health care (+$40.6B) was the largest contributor within consumption.
-
Gross private domestic investment rose +3.8% SAAR (strongest since Q1), but residential investment fell -1.5% SAAR for a fourth straight decline while nonresidential investment +3.7% SAAR was led by information processing equipment (+0.65 ppts) and R&D (+0.25 ppts).
-
Net exports added only +0.08 ppts to GDP as exports -0.9% SAAR and imports -1.3% SAAR both declined, with the smaller drop in exports offset by weaker imports.
-
Government spending and investment contracted -5.1% SAAR, including federal activity -16.6% SAAR, the second largest contraction in nearly 15 years; workforce reductions alone subtracted about -1.0 ppts from GDP growth.
-
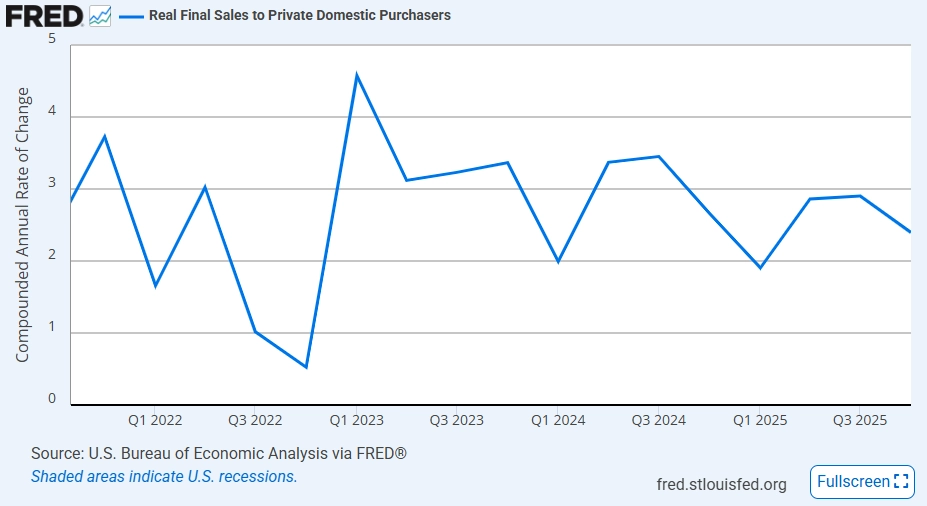
Final sales to private domestic purchasers grew +2.4% SAAR (vs +2.9% in Q2 and Q3), indicating more stable underlying private demand than the headline GDP figure.
-
Growth contributions remained concentrated in health care spending and AI-related investment, while real estate and nonresidential structures remained weak.
-
-
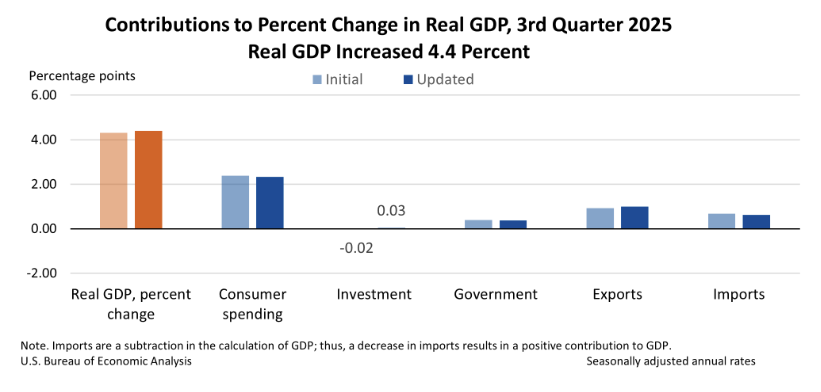
U.S. real GDP growth in Q3 2025 was revised up to +4.4% SAAR (from +4.3% SAAR initial), reflecting slightly stronger top-line momentum than first reported.
-
The +4.4% SAAR increase in Q3 (vs +3.8% in Q2) was driven by gains in consumer spending, exports, government spending, and investment, while imports fell (imports subtract from GDP).
-
The +0.1 ppt upward revision to GDP primarily reflected upward revisions to exports and investment, partly offset by a downward revision to consumer spending; imports were revised up.
-
Real final sales to private domestic purchasers rose +2.9% SAAR, revised down -0.1 ppt from the prior estimate, indicating slightly softer underlying private domestic demand than initially reported.
-
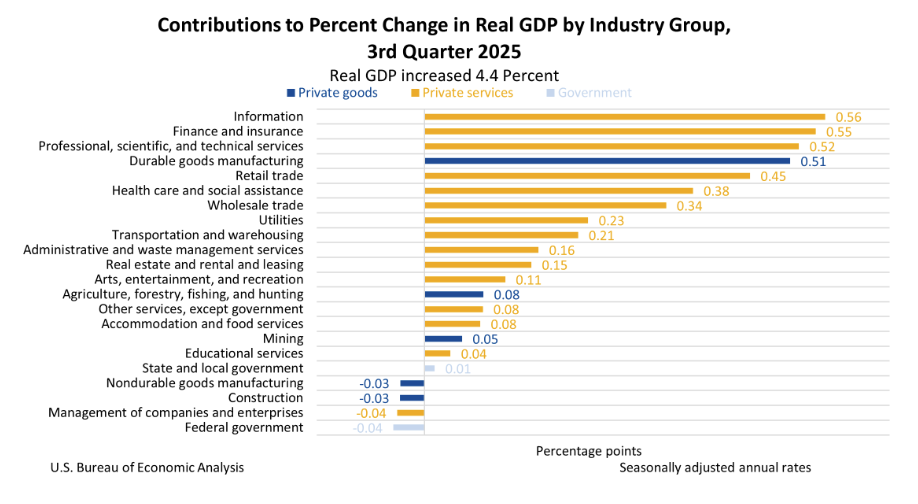
From an industry view, real GDP gains reflected a +5.3% increase in real value added for private services-producing industries and a +3.6% increase for private goods-producing industries, partly offset by a -0.3% decline in government value added.
-
Real gross output increased +3.2% SAAR, with private services up +4.4% and government up +2.1%, while private goods-producing industries declined -0.1%.
-
Inflation measures were unchanged from the initial estimate: gross domestic purchases price index +3.4%, PCE price index +2.8%, and core PCE price index +2.9%.
-
Real GDI increased +2.4% SAAR (unchanged), while the average of real GDP and real GDI was +3.4% (unchanged), keeping the combined output-income signal steady.
-
Corporate profits from current production rose +$175.6B, revised up +$9.5B, indicating somewhat stronger profit growth than first estimated.
-
-
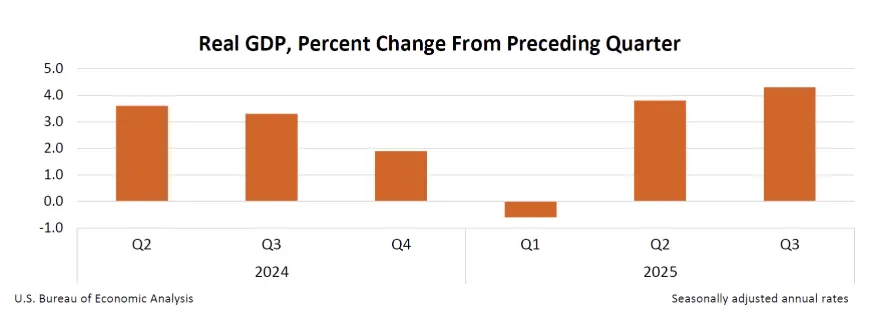
Third-quarter economic growth smashed expectations and blew by the Atlanta Fed’s forecast this morning. Real GDP expanded at a seasonally adjusted annual rate (SAAR) of 4.3% in Q3 2025, the strongest growth since Q3 2023 and above expectations of a print around 3.3% (analysts’ consensus) to 3.5% (Atlanta Fed nowcast). Growth was led by consumer spending, while investment was a very minor drag, and the contribution from trade was positive. Let’s dive into the details.
GDP Segments
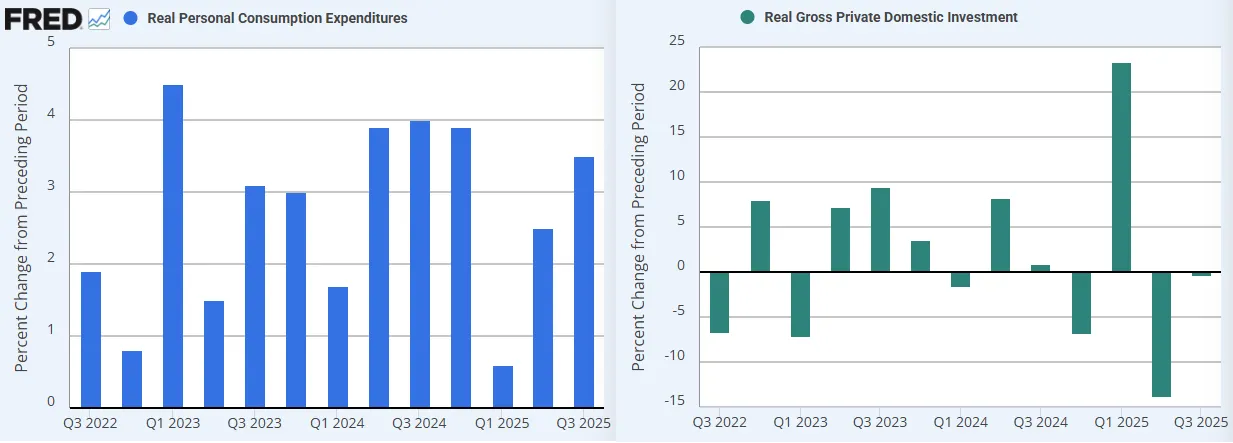
The consumer was the star in Q3 2025 as personal consumption expenditures increased at a SAAR of 3.5%, the strongest so far this year and only slightly trailing behind PCE growth in the last three quarters of 2024. Spending was strong across both goods and services, which saw growth rates of 3.1% and 3.7%, respectively. Notably, the pace of services spending was the strongest since Q3 2022. The contribution of consumer spending to overall GDP growth was 2.39 ppts, the largest contributor of the main GDP segments. The Q3 result speaks to the resiliency of the consumer who has faced many headwinds this year.
While consumer spending was robust, the private domestic investment data left a lot to be desired. The segment was basically unchanged in Q3, declining at a SAAR of -0.3%, which is the second straight quarterly contraction. The real estate sector was a drag on growth for the third straight quarter as residential investment fell -5.1%, offsetting nonresidential investment growth of 2.8%. Within non-residential investment, equipment (+5.4%) and intellectual property (+5.4%) saw solid growth, dampened by a weakening in investment in structures (-6.3%) for the seventh straight quarter. Technology investment led once again in Q3, with information processing (+$12.5 billion) and R&D (+$14.0 billion) leading in the raw investment numbers.
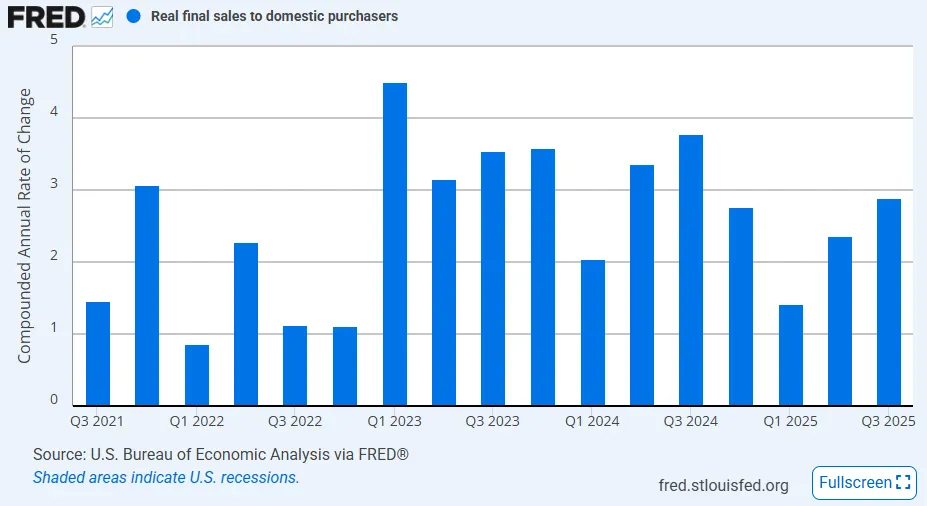
The interplay of inventory and trade were sources of volatility in Q1 and Q2 growth data, but the dynamics in Q3 were not as drastic. Net trade contributed 1.59 ppts to GDP growth as exports expanded at a SAAR of 8.8% and imports fell at a SAAR of -4.7%. This was slightly offset by a -$11.4 billion drop in private inventories, which contributed -0.22 ppts to growth. Excluding the positive contribution by trade, we see final sales to domestic purchasers growth at 2.9%, slower than the headline real GDP growth but still the strongest so far this year.
Price Indexes
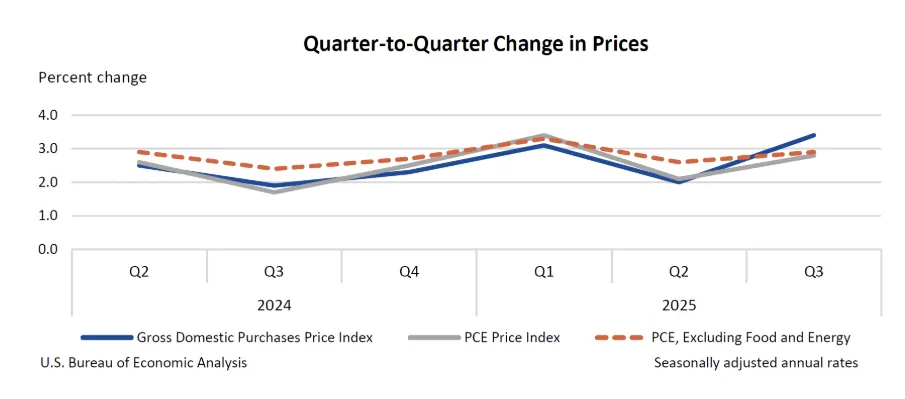
GDP data also comes with some price indexes, though these updates will be basically obsolete in the context of the current inflation outlook. The gross domestic purchases price index increased at a 3.4% annualized rate and was up 2.7% YoY in Q3 2025, accelerating from 2.3% YoY in Q2 to the highest level since Q3 2023. The Fed’s preferred inflation gauge, the core PCE price index, grew at a slower annualized pace of 2.9% and saw an acceleration from 2.7% YoY in Q2 to 2.9% YoY in Q3. These data points suggest that pricing pressures saw a significant increase in Q3 2025, which may or may not be traced back to tariffs. Indeed, the strong consumer spending impulse in the quarter could have been the source of upward pressure from the demand side.
Corporate Profits
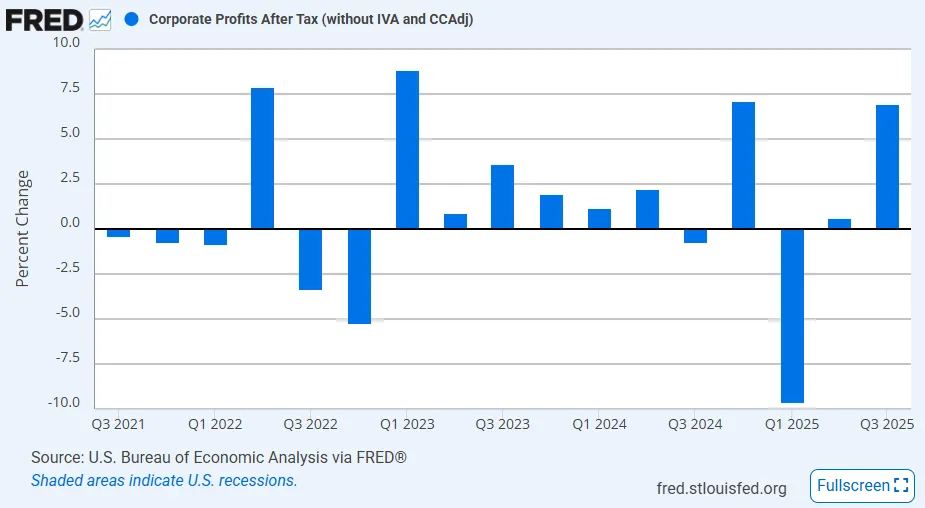
Since this first GDP report was not the advance estimate and more consistent with the traditional first revision, it included corporate profit data for Q3 2025. The data showed a strong $166.1 billion increase in overall corporate profits, well above the $6.8 billion gain in Q2 and the -$47.8 billion contraction in Q1. Domestic profits (after inventory adjustments) increased by $154.3 billion, with financial profits up $54.0 billion and nonfinancial profits up $100.4 billion. Overall, it is clear that corporations enjoyed a solid quarter of profits. After tax, inventory-adjusted profits increased 7.0% QoQ and were up 4.2% YoY.
-
GDP
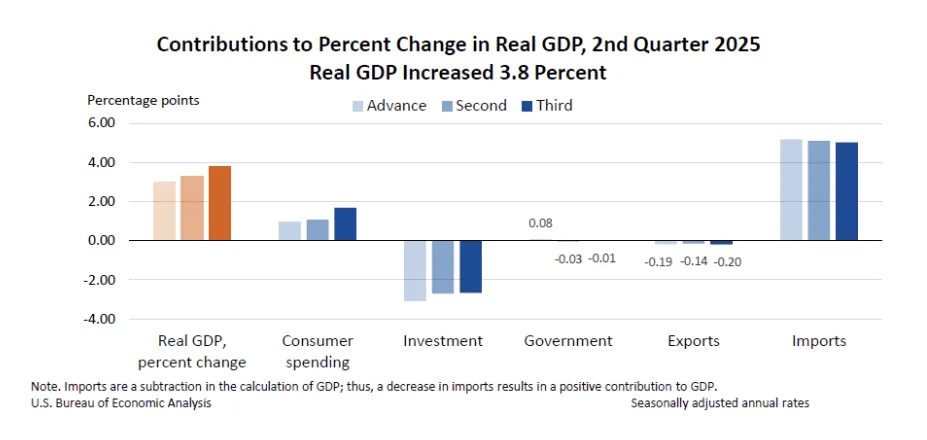
The final estimate of Q2 2025 GDP growth saw a strong upward revision this morning to a SAAR of 3.8%. This is up significantly from the second estimate of 3.3% and the advance estimate of 3.0%, and the revision confirms that Q2 2025 GDP growth was the strongest in a quarter since Q3 2023. The positive adjustment was most heavily driven by the consumer spending segment of growth, but most of the other components also saw upward revisions.
- Personal consumption increased at a SAAR of 2.5% in Q2 2025, according to the final estimate, revised up significantly from the 2nd estimate of 1.6%. That revision was entirely driven by spending on services, which actually increased 2.6% in Q2, much higher than the 2nd estimate of 1.2%. Offsetting the strong upward revision in services spending was a slight downward revision to goods spending from 2.4% in the 2nd estimate to 2.2%. Overall, the consumer spending component contributed 1.68 ppts to headline GDP growth (vs 1.07 ppts in the 2nd estimate), accounting for the entire 0.5 ppts upward revision.
- The estimated growth in gross private domestic investment in Q2 was unchanged at -13.8% in the final estimate. This reflects a slight upward revision in fixed investment growth, offsetting a downward revision in the private inventories component. Within fixed investment, nonresidential investment grew 7.3% (vs 5.7% in 2nd estimate), and residential investment declined -5.1% (vs -4.7% in 2nd estimate).
- The net exports component’s positive contributions were revised down slightly from 4.95 ppts in the 2nd estimate to 4.83 ppts in the final estimate. Exports saw a slightly larger decline of -1.8% (vs -1.3% in 2nd estimate), and the decline in imports was adjusted up slightly to -29.3% (vs -29.8% in 2nd estimate).
- Much like the investment component, the growth in government consumption and investment in Q2 did not see much of a revision at -0.1%, up slightly from -0.2% in the 2nd estimate. Within the segment, the divergence between federal and state & local consumption and investment intensified with the former at -5.3% (vs -4.7% in the 2nd estimate) and the latter at 3.1% (vs 2.6% in the 2nd estimate).
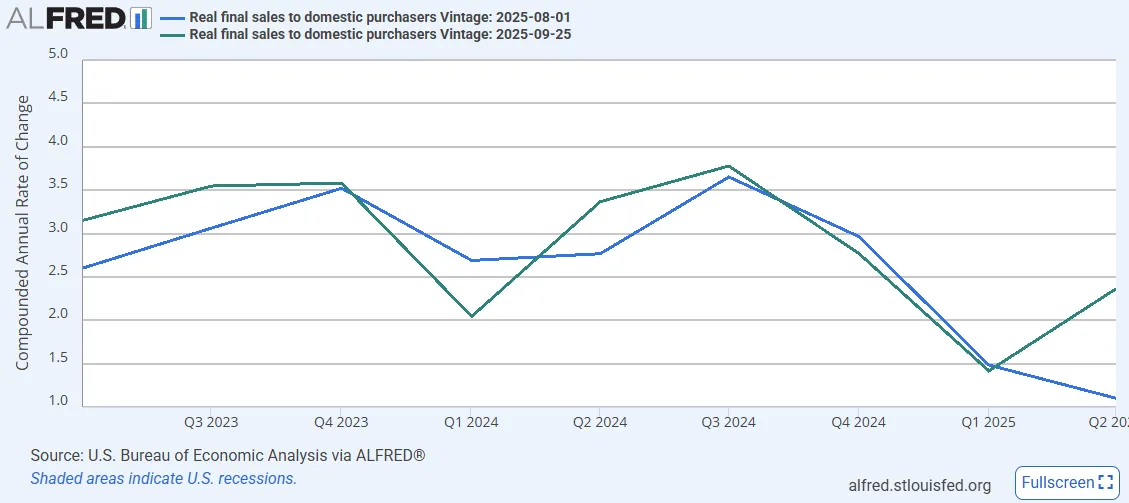
The final GDP revisions challenge the narrative of a slowing U.S. economy. Final sales to domestic purchasers, a measure that strips out the volatile swings in net exports and inventories, came in at 2.4%, more than double the initial estimate of 1.1% and well above the second estimate of 1.6%. These points more clearly to a rebound from Q1’s weakness, underpinned by stronger consumer spending, and stand in contrast to softer labor market data from Q2. Notably, the solid Q2 performance came even as federal government spending made a second consecutive negative contribution of more than -0.3 ppts to growth.
PCE Inflation
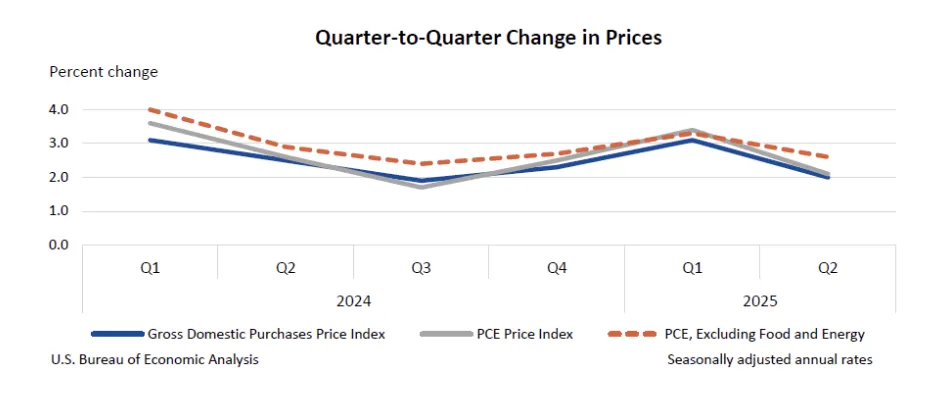
The other significant revision to acknowledge in the final Q2 2025 GDP report was upward revisions to both headline and core PCE inflation. Both were adjusted up by 0.1 ppt to 2.1% and 2.6%, respectively, and added to stronger price growth, which saw the gross domestic purchases price index by revised up to 2.0% (from 1.8% in the 2nd estimate). However, this didn’t have an impact on longer-term inflation because Q1 2025 price data was revised down. As a result, the YoY rates for PCE and core PCE inflation were unchanged at 2.4% YoY and 2.7% YoY, respectively. Similarly, the gross domestic purchasers annual rate was unchanged at 2.3% YoY. The changes in the price data likely just reflect the newly discovered strength in consumer spending in Q2, and another slight downward revision to Q2 data.
Industry GDP
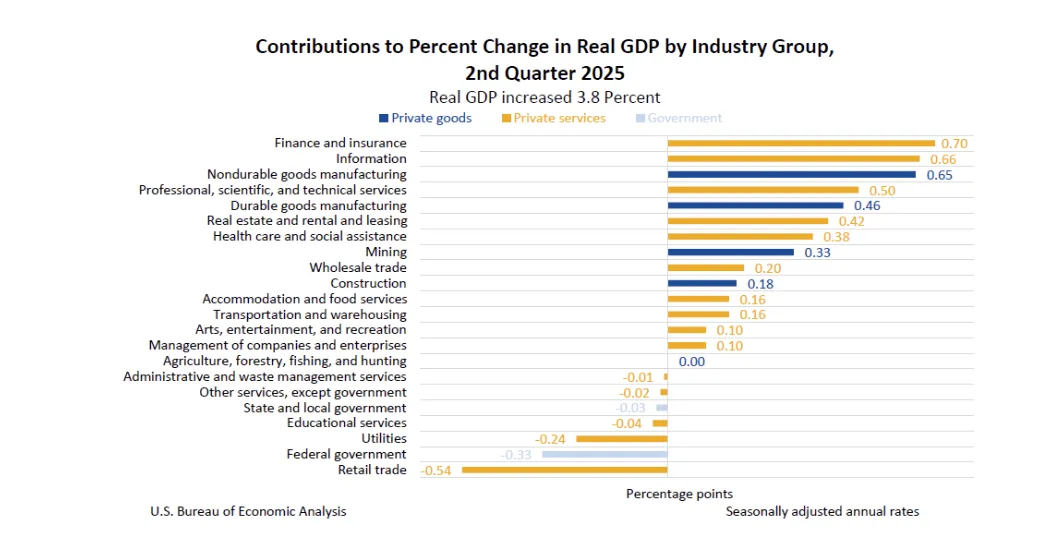
The final GDP report also provides us with a view of how GDP trended by industry. In Q2, the goods sector was the primary driver of growth, with real value added up at a SAAR of 10.2%. This was supplanted by a solid quarter for the services sector, up 3.5%, and dampened by a weak government sector, down -3.2%. The strongest industries in Q2 were finance & insurance (+0.70 ppts) and information (+0.66 ppts), suggesting that AI factors and a strong equity market were key drivers of growth in the quarter. While these segments were strong, the full manufacturing industry (combining durable and nondurables) added 1.11 ppts of growth and stands out as the top performer. This was likely fueled by tariffs which have caused domestic producers to see an increase in demand from local customers who want to avoid import duties and foreign customers trying to front-run the higher tariff rates.
-
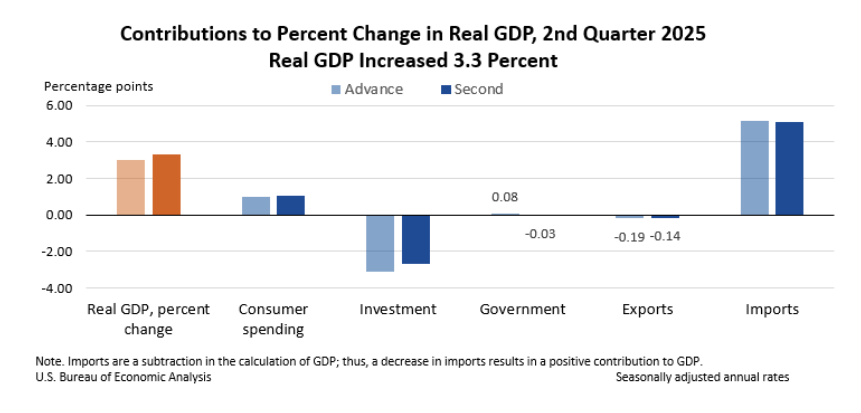
US real GDP grew at an annualized rate of +3.3% in Q2 2025, revised up from +3.0% in the advance estimate, following a -0.5% contraction in Q1.
-
The upward revision reflected stronger investment and consumer spending, partly offset by weaker government spending and higher imports.
-
Personal consumption growth was 1.6% at a SAAR in the second estimate, revised up from 1.4%.
-
The decline in private investment was revised up from -15.6% in the 1st estimate to -13.8%.
-
Federal government consumption growth was the weakest since 2022 Q1 at -8.5% as nondefense spending growth was the weakest since Q2 2021 at -14.3%.
-
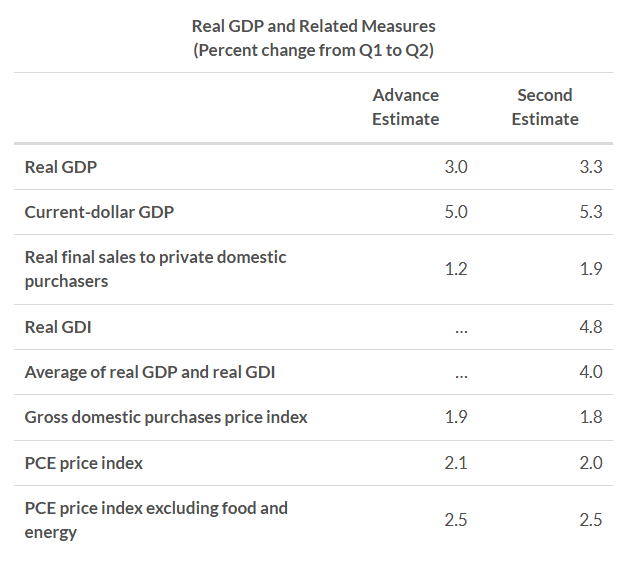
Real final sales to private domestic purchasers rose +1.9% (revised up +0.7 ppts), showing firmer underlying private demand.
-
The gross domestic purchases price index increased +1.8% (revised down -0.1 ppt), while the PCE price index rose +2.0% (also revised down -0.1 ppts) and core PCE held steady at +2.5%.
-
Real gross domestic income (GDI) jumped +4.8% after just +0.2% in Q1, bringing the average of GDP and GDI to +4.0%.
-
Corporate profits rebounded +$65.5 billion in Q2, reversing part of the -$90.6 billion decline in Q1. The increase in profits was driven by a $59.1 billion increase in the nonfinancial sector.
-
-
-1.png)
US GDP grew at a 3.0% SAAR in Q2 2025, rebounding from a -0.5% contraction in Q1, driven by stronger consumption and a sharp drop in imports.
- Personal consumption expenditures rose +1.4% in Q2 (vs +0.5% in Q1), with durable goods up +3.7% and services up +1.1%.
- Gross private domestic investment fell -15.6% (vs +23.8% in Q1), as equipment spending collapsed and inventories declined.
- Net exports added to growth as imports plunged -30.3%, driven by a -35.3% drop in goods, while exports fell -1.8%.
- Government spending rebounded +0.4% after a -0.6% decline in Q1, as state and local outlays rose +3.0%.
- Final sales to domestic purchasers grew +1.2%, slowing from +1.9% in Q1, while final sales to private domestic purchasers rose +1.2% (vs +1.9%).
-
GDP Growth
-1.png)
Economic growth in the first quarter of 2025 was revised down significantly in the third and final estimate released today. After the second estimate, real GDP growth was reported at -0.2%, up slightly from -0.3% in the advance estimate. The upgrade has been reversed and more as the final estimate of real GDP growth in Q1 2025 landed at -0.5% as the contributions of consumption, investment, and net exports were all revised down.
- Personal consumption expenditure (PCE) growth was revised down from an SAAR of 1.2% in the second estimate to just 0.5% in the final estimate which means that consumption contributed just 0.31 ppts to headline GDP growth, the lowest since consumer spending saw a massive contraction during the pandemic, and before that, since Q2 2011. The downward revision in spending was entirely in expenditures on services which grew at a rate of just 0.6% as opposed to the 1.7% growth in the second estimate.
- Private domestic investment growth was still reported as strong, at 23.8%, but slightly weaker than the last estimate of 24.4%. Residential investment appears to have contracted more than previously thought, declining at a SAAR of -1.3%, down from the -0.6% in the 2nd estimate. The inventory component of growth was also revised in the final estimate, down -5 bps to 2.59 ppts. Compared to consumption, the revisions in investment were not as significant.
- Offsetting some of the negative revisions was an upward shift in the estimate of the contribution from net exports. The second estimate found it at -4.90 ppts with a surge in imports dragging growth down by -5.16 ppts, offset by exports contributing 0.26 ppts. In the final estimate, the BEA found that trade activity was lower overall but in a way that was favorable to GDP growth. The net exports contribution has landed at -4.61 ppts now with exports revised down to 0.04 ppts but imports revised up to -4.66 ppts.
-2.png)
The obvious focus of the GDP revisions is on the newfound weakness in personal consumption which will cause many to reassess their views of the strength of the US economy in Q1 2025. Consider the change to private domestic final purchases (PDFP), a measure that excludes net exports which Fed Chair Powell has referred to in supporting his (and the Fed’s) view that the economy was still solid in Q1. The second estimate had PDFP growth at 2.5% (already revised down from the advance estimate of 3.0%), but that has now been revised down to just 1.9% in the final estimate, the first time this measure fell below 2% since Q4 2022.
-3.png)
The fact that this downward revision was rooted in weak services spending suggests that softer growth had little to do with tariffs and more to do with a decline in consumer sentiment and financial health. In fact, when looking at GDP contributions by industry, the discretionary services segments stick out as having the largest downward revisions: recreation services downgraded -18 bps to -0.14 ppts, food services & accommodations downgraded -5 bps to -0.09 ppts, transportation services downgrade -9 bps to -0.03 ppts. These three industries accounted for about 65% of the downward revision in the contribution from services consumption growth.
PCE Inflation
-4.png)
While growth was revised down, the measures of prices in the GDP report were revised up. Both the headline and core PCE inflation SAAR were revised up 0.1 ppts to 3.7% and 3.5%, respectively. However, the YoY rates for both data points were unchanged at 2.5% YoY and 2.8% YoY. The changes in the price data were much less significant than the growth revisions, and the more important update on price data will come tomorrow when the May personal income and outlay reports come out. Regardless, it is not good news to see price data revised up, even if slightly, in the same report as a significant downward adjustment in consumption. This only further complicates the Fed’s task of navigating upside risks to inflation coinciding with downside risks to employment.
Here are some other highlights from the final GDP estimate:
- While gross domestic product growth was revised down, the estimate of gross national income (GNI) was revised up, from a -0.2% decline in the second estimate to an increase of 0.2% in the final estimate. This is odd because GDP and GNI growth are meant to track each other pretty closely, so a divergence in a revised report like this raises some eyebrows. One reason for a deviation could be that foreign incomes increased relative to domestic incomes. This could be a suggestion that the introduction of tariffs had an immediate negative impact on domestic profits while foreign operations fared better.
-5.png)
- The final estimate of growth includes a breakdown by industry. The BEA found that goods sector real value added dropped at an SAAR of -2.8% while the decline in services was just -0.3%. However, the latter was boosted by two industries: information (0.56 ppts GDP contribution) and real estate (0.66 ppts GDP contribution). Value added from government increased at a SAAR of 2.0% with all of that coming from state and local governments. The BEA found that the federal government made no contribution to GDP in Q1 2025.
-
-1.png)
The 2nd estimate of Q1 2025 US GDP growth is -0.2%, revised up from -0.3% in the initial estimate.
- Real final sales to private domestic purchasers saw a significant downward revision of -0.5 ppts to 2.5% as household consumption was revised down.
- Personal consumption growth was revised down from an SAAR of 1.8% in the first estimate to 1.2%. Both goods and services consumption were revised lower, by -0.4 ppts to 0.1% and -0.7 ppts to 1.7%, respectively.
- Gross private domestic investment growth was revised up from 21.9% to an even stronger 24.4%.
- The contribution of PCE fell -41 bps to 0.80 ppts but was offset by an upward revision in the inventory contribution of 39 bps to 2.64 ppts.
- The annual increases in the GDP price index and the core PCE price index were both revised down by -0.1 ppts to 3.3% YoY and 3.4% YoY.
- Gross domestic income is estimated to have fallen -0.2% after a 5.2% gain in Q4 2024.
- Corporate profits fell -$118.1 billion in Q1 2025 following a $204.7 billion increase in Q4 2024.
-
US GDP growth for Q1 2025 was reported this morning, and the report was worse than expected. The first quarter contraction in 2025 is the first negative quarter of GDP growth since Q1 2022. What was expected was a report that was heavily skewed by trade data as net exports was the sole reason for the decline in GDP.
GDP Growth
-1.png)
US GDP saw a slight decline in Q1 2025, falling at a -0.3% seasonally adjusted annual rate (SAAR), which was worse than the consensus expectations of an increase at a slight 0.3% SAAR. Not only is this the weakest quarterly growth rate in three years, but it is also the first contraction since the -1.0% SAAR decline in Q1 2022. On a more positive note, the advance estimate was ahead of the Atlanta Fed’s GDPNow nowcast for Q1 2025 growth of -2.7% (last updated on April 29th, 2025) and also ahead of the gold-adjusted nowcast of -1.5%. For those who were following the whipsaws in the nowcast, the BEA’s GDP report might be somewhat of a positive surprise.
-2.png)
The key segment dragging down GDP growth in the first quarter was the net exports component. A large increase in imports (41.3% SAAR) in Q1 offset a smaller gain in exports (1.8% SAAR), which resulted in a -4.83 ppts contribution from net exports to headline GDP growth. This was the largest negative contribution from net exports since GDP records began in 1947. This is not really a surprise as it is consistent with the Atlanta Fed’s nowcast of the net exports component, and it reflects the effect of companies pulling forward imports to a massive degree ahead of the implementation of Trump’s tariff policies.
-3.png)
The large increase in imports also led to an increase in inventories that partially offset the negative net exports contribution. In Q1 2025, the contribution from private inventories was 2.25 ppts, the largest since firms built up inventories during the COVID supply chain crunch. When excluding both the net exports and the inventory component, GDP growth comes out to around 2.3% as a result of an increase in consumption and investment. This number is consistent with the growth in final sales to domestic purchasers, which grew at a 2.3% SAAR, and reflects solid domestic demand in the first quarter.
Domestic Demand
-4.png)
Details on the subsegments within domestic demand:
- Personal consumption expenditures (PCE) increased at a 1.8% SAAR in the first quarter, the weakest since Q2 2023 but a solid increase nonetheless. Consumption was driven by a strong March where real PCE increased 0.7% MoM after a decline of -0.4% MoM in January and a small 0.1% MoM increase in February. The increase in March was especially driven by a surge in spending on autos as consumers pulled forward car purchases ahead of auto tariffs. In the final month of Q1, durable goods spending jumped 3.2% MoM including $4.7 billion spend on motor vehicles and parts.
- Fixed investment was another strong source of GDP growth as it increased at a SAAR of 7.8% and contributed 1.34 ppts to top line GDP growth. This included an increase at a SAAR of 9.8% in nonresidential investment as equipment investment surged, also likely related to companies pulling forward spending on machinery and tools ahead of tariffs. Residential investment was much weaker at just 1.3%.
- The final piece of domestic demand is the government component which contracted for the first time since Q2 2022. Government consumption declined at a SAAR rate of -1.4% with federal consumption down -5.1% and state & local spending marginally up 0.8%. The contraction was a small piece of the GDP puzzle, however, as the contribution to top line GDP growth was just -0.25 ppts. Nevertheless, the Trump administration, through DOGE, has made it clear that it intends to keep drawing down government expenditures over the next few years, so the government components will likely continue to weigh on growth for some time.
So while the headline growth figure pointed to a contraction, the flurry of activity caused by the impending tariff policy resulted in strong domestic economic activity in Q1 2025. The question then becomes, will we see the same domestic activity in the second quarter of this year? Reports on consumer sentiment and business outlooks suggest that this will not be the case unless Trump’s trade policies are reversed. Specifically, it is possible that we see consumption (C) and investment (I), including the inventory contribution, turn negative in Q2 2025 even if the net exports component (X) bounces back on a decline in imports. If that is the case, we could very well see a recession materialize.
-
-1.png)
The third estimate of US GDP in Q4 2024 sees two key revisions:
- Real GDP growth revised up 0.1 ppt to 2.4%.
- Core PCE inflation (quarterly SAAR rate) revised down -0.1 ppt to 2.6%.
- Gross domestic purchases price index (quarterly SAAR rate) revised down -0.1 ppt to 2.2%.
-2.png)
Other key results:
- Compared to Q3 2024, the deceleration in real GDP in Q4 2024 primarily reflected downturns in investment and exports that were partly offset by an acceleration in consumer spending. Imports turned down.
- From an industry perspective, the increase in real GDP reflected an increase of 2.3% in real value added for private goods-producing industries, an increase of 2.4% for private services-producing industries, and an increase of 2.7% for government.
- Real gross output increased 1.7% in Q4 2024, reflecting an increase of 0.3% for private goods-producing industries, an increase of 2.0% for private services-producing industries, and an increase of 3.1% for government.
- Profits from current production (corporate profits with inventory valuation and capital consumption adjustments) increased $204.7 billion in the fourth quarter, in contrast to a decrease of $15.0 billion in the third quarter.
-
-1.png)
The 2nd estimates of Q4 2024 and full year 2024 GDP growth were unchanged at 2.3% and 2.8% respectively.
- Real GDP was revised up by less than 0.1 ppt from the advance estimate released last month, primarily reflecting upward revisions to government spending and exports that were partly offset by downward revisions to consumer spending and investment.
- However, both PCE and core PCE inflation were revised up by 0.1 ppts to 2.4% and by 0.2 ppts to 2.7% respectively.
- The price index for gross domestic purchases increased 2.3% in Q4 2024 and 2.4% in 2024, both revised up 0.1 ppt.