US CPI
- Source
- BLS
- Source Link
- https://www.bls.gov/
- Frequency
- Monthly
- Next Release(s)
- October 15th, 2025 8:30 AM
-
November 13th, 2025 8:30 AM
-
December 10th, 2025 8:30 AM
Latest Updates
-
Inflation data for August pointed to a modest but broad-based pickup in price growth, with pressures showing up across both goods and services. The report highlighted a rebound in several volatile categories, while core measures continued to show steady gains that suggest price momentum has firmed again in recent months. Although the details were mixed, the overall picture reflects a shift away from the disinflationary trend earlier in the year and raises fresh questions about how durable underlying inflation pressures might be heading into the fall.
CPI
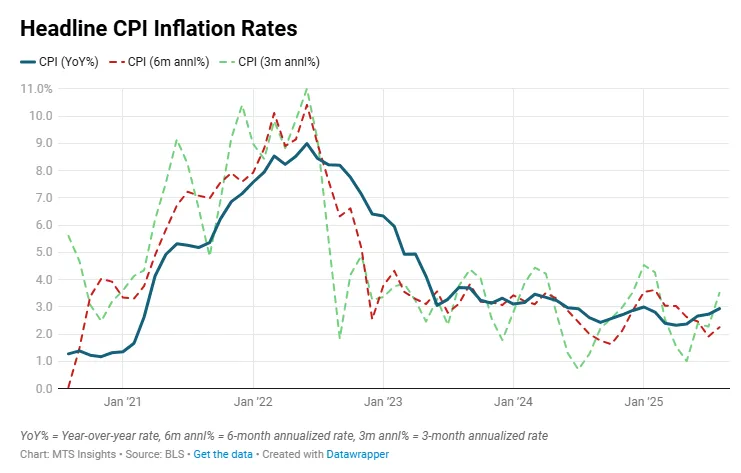
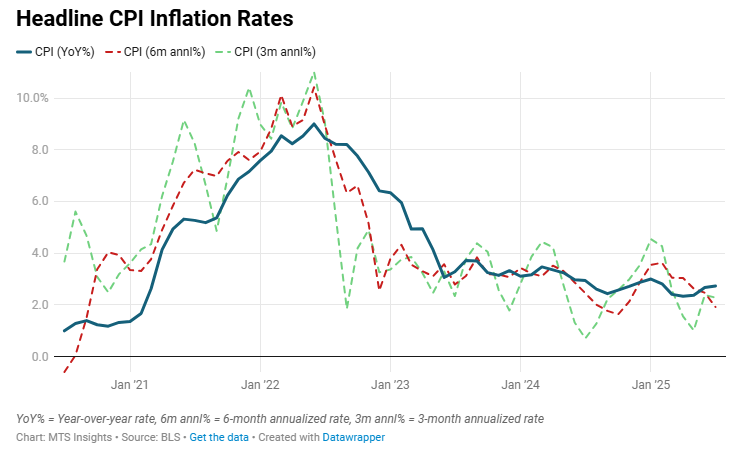
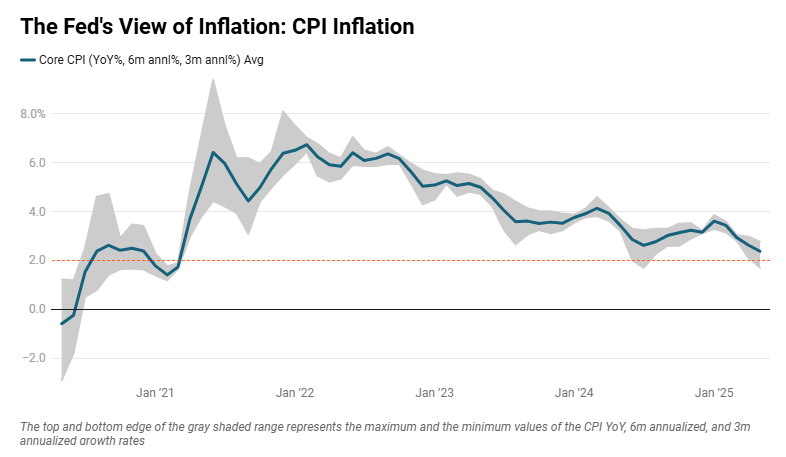
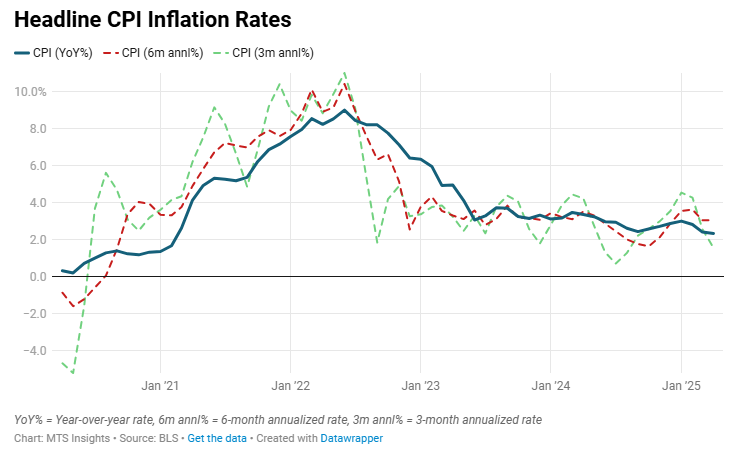
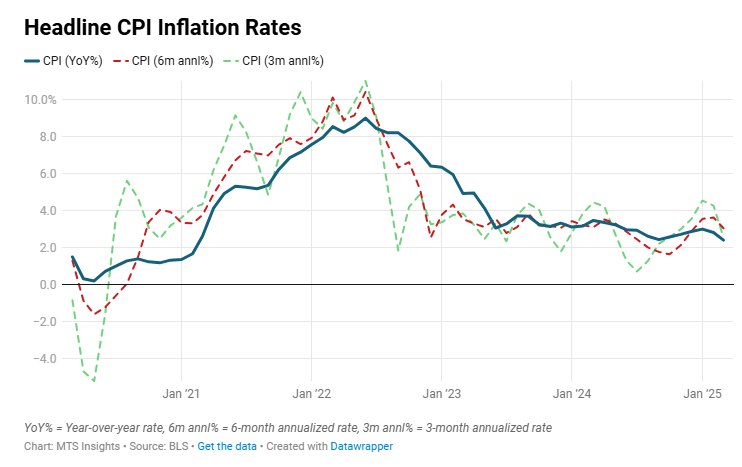
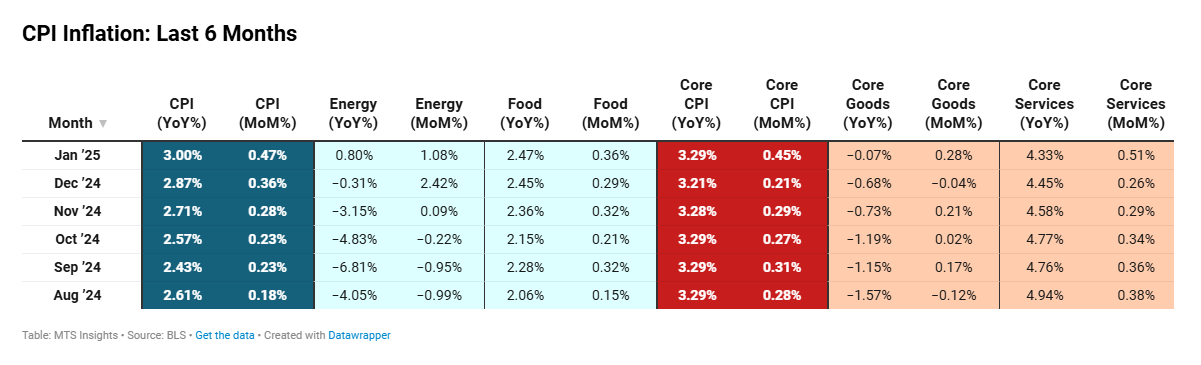
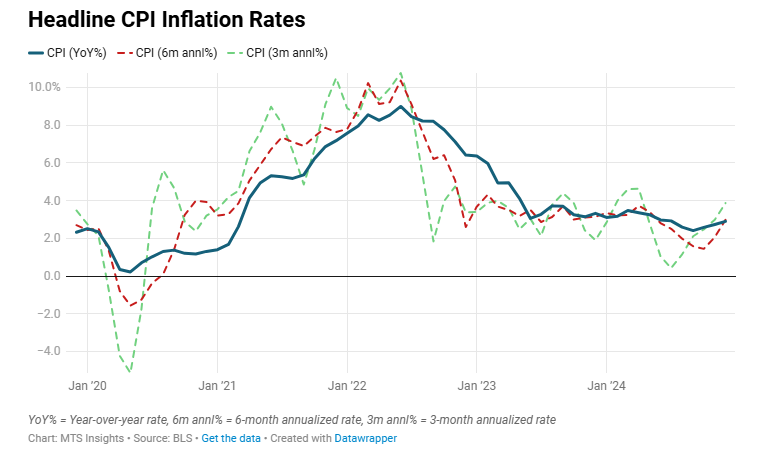
US CPI increased 0.4 MoM in August, the largest one-month increase since January and slightly ahead of expectations of a 0.3% MoM rise. All major segments of inflation increased last month, reflecting a continued moderate rise in prices to start Q3 2025. On an annual basis, CPI was up 2.9% YoY, accelerating from 2.7% YoY in July and the highest since January. A large part of this reacceleration in the headline inflation rates came from a rebound in the volatile components.
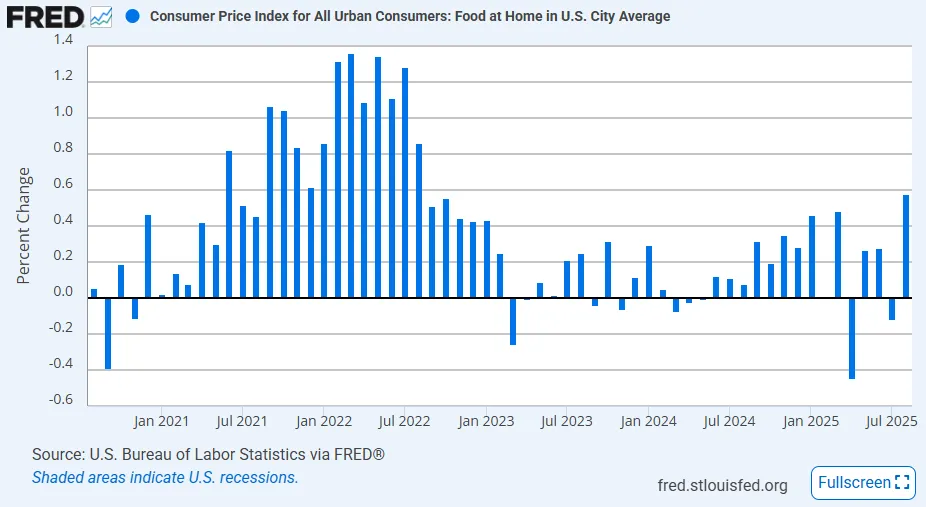
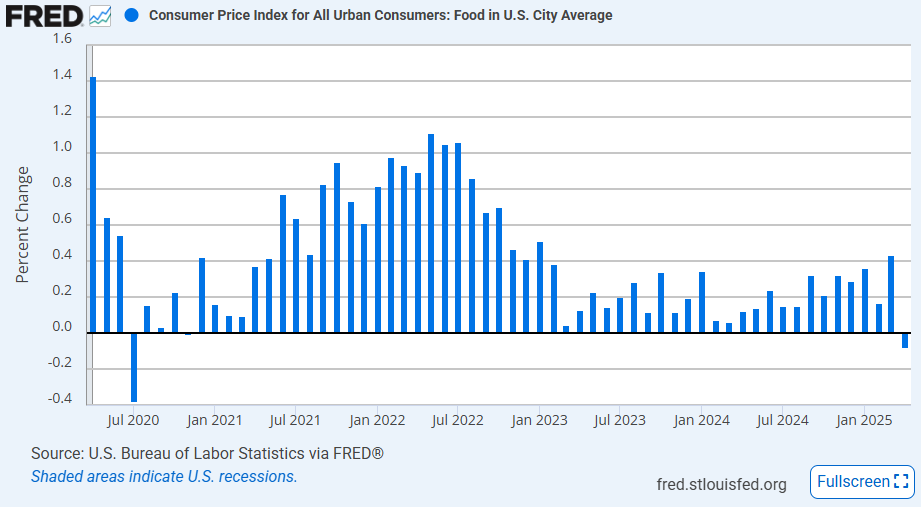
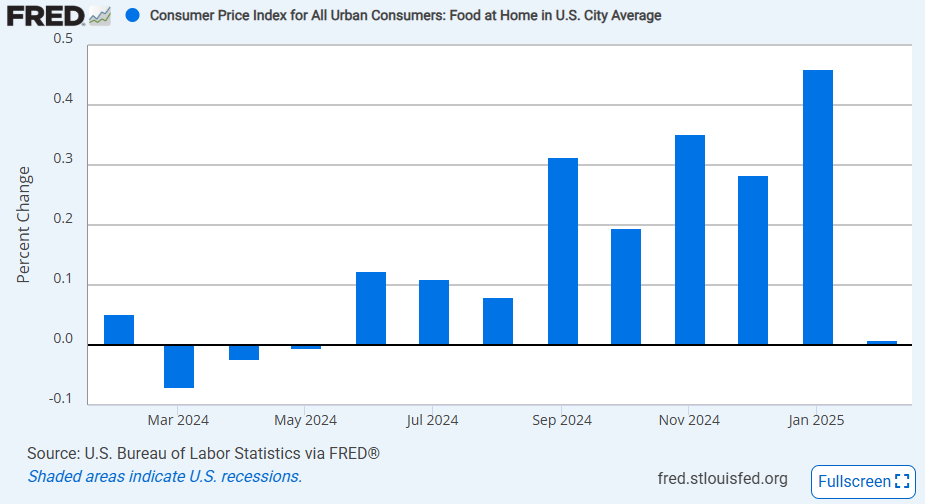
- Food prices increased 0.5% MoM in August, the largest monthly increase since January 2023. This included a strong 0.6% MoM rise in the food at home index which was the largest monthly gain in almost three years. All six grocery components increased but the hot print was especially driven by a 1.6% MoM rise in fruit & vegetable prices (which was the largest since February 2022) and a 1.0% MoM rise in meats, poultry, fish & egg prices. The food away from home index also increased, up 0.3% MoM, pushed higher mainly by prices for full-service meals rising 0.4% MoM. On an annual basis, food prices are now up 3.2% YoY, the highest since October 2023.
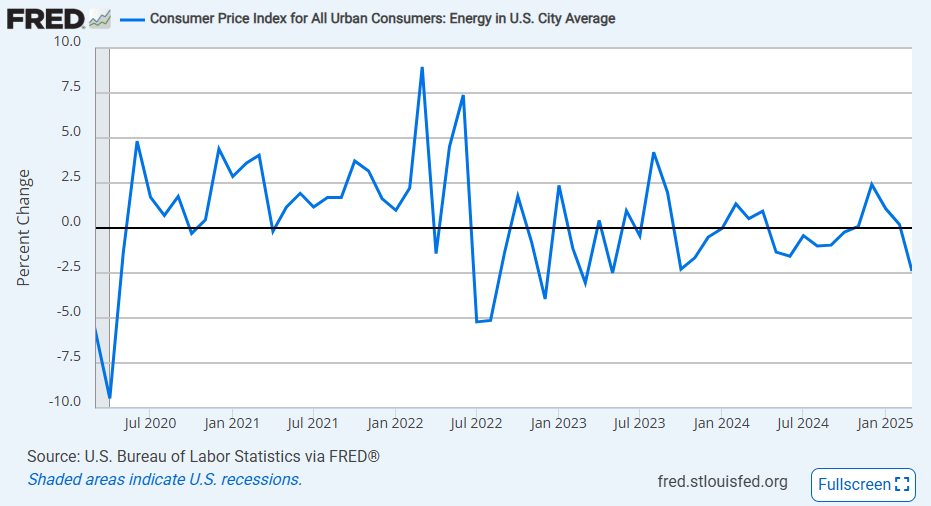
- The volatile energy component contributed with a rise of 0.7% MoM in August, bouncing back from a -1.1% MoM decline in July. Energy goods prices jumped 1.7% MoM, offsetting a small -0.2% MoM drop in energy services prices. Specifically, there was a 1.9% MoM rise in gas prices that pushed energy consumer prices higher as this subcomponent has the highest weight. However, on an annual basis, energy price growth is still benign, up just 0.2% YoY, thanks to weak energy commodity prices.
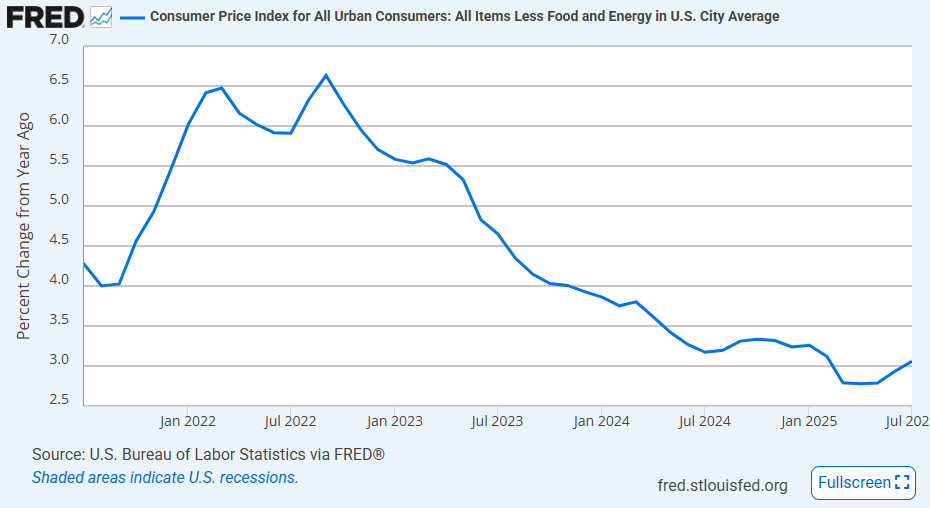
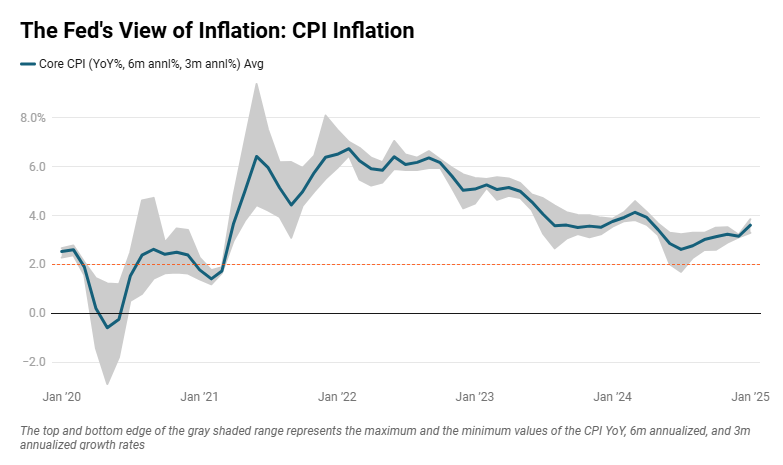
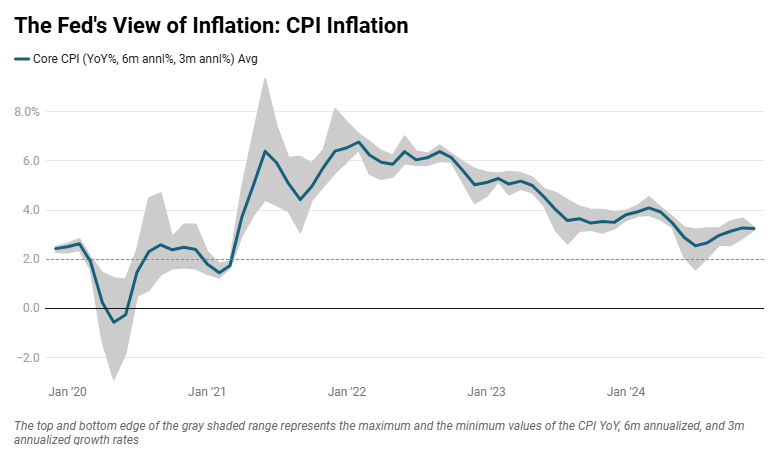
Core CPI
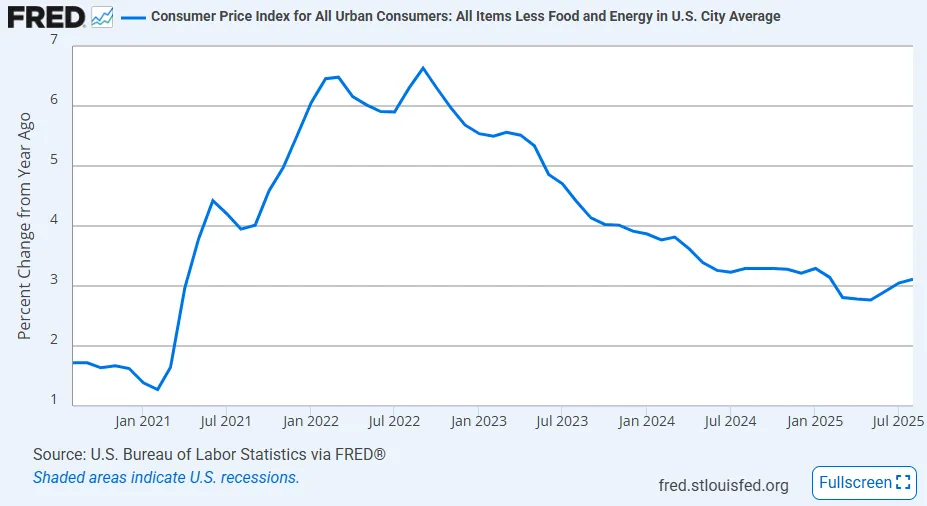
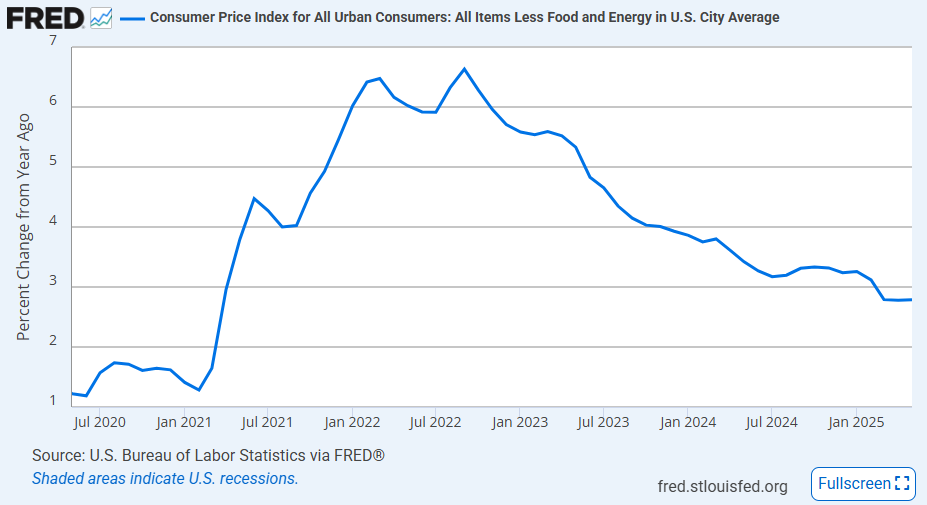
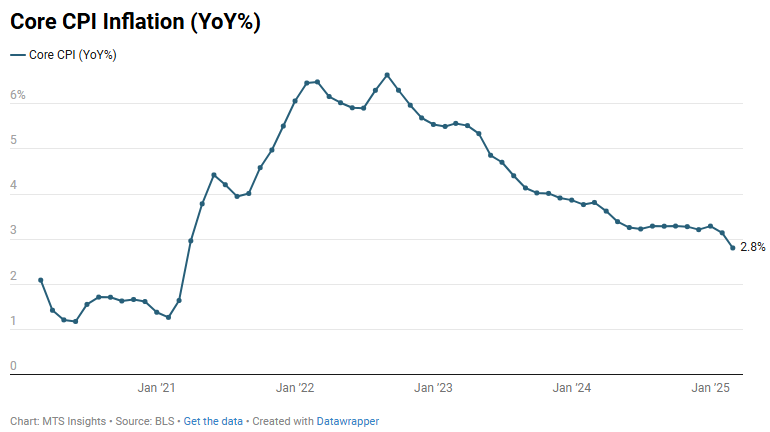
The core CPI components also saw a moderate gain in August, collectively rising 0.3% MoM for the second straight month. This was in line with expectations, but also the second highest monthly rise since January. The emerging trend suggests that inflationary pressures have picked up in Q3, advancing from the disinflationary trend in Q1 and Q2. Moderate price growth was visible across both goods and services categories, which were both up 0.3% MoM. The details, though, showed a more mixed view.
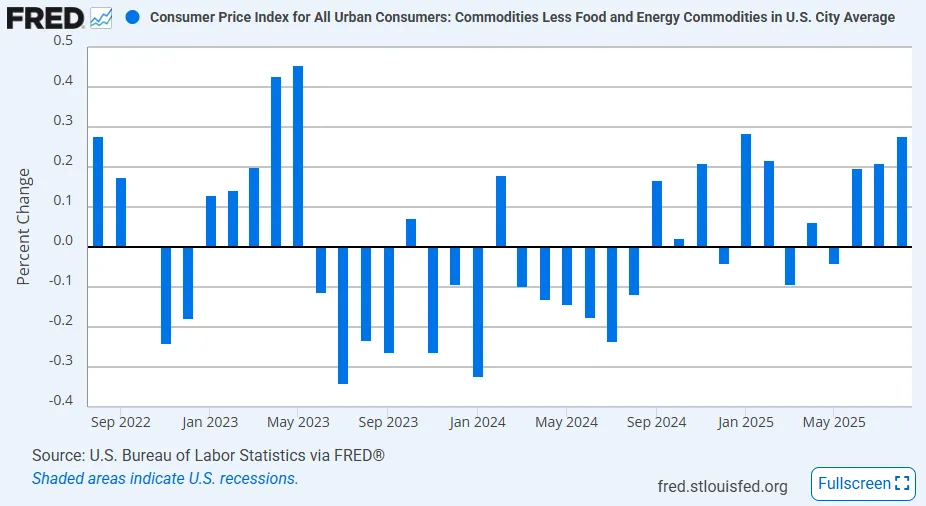
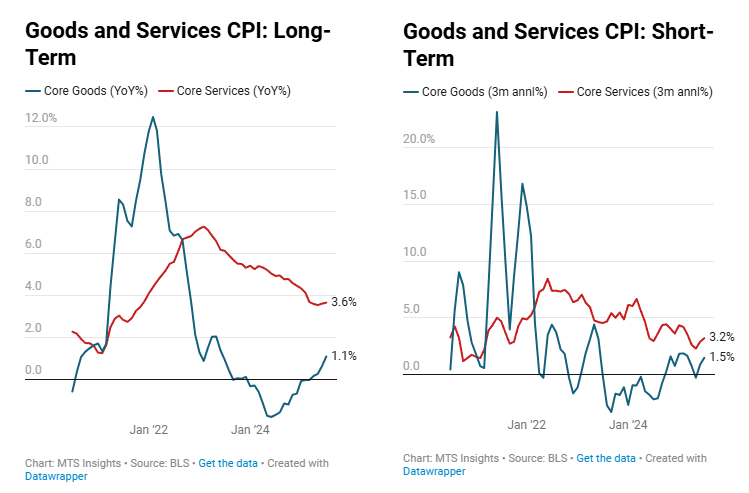
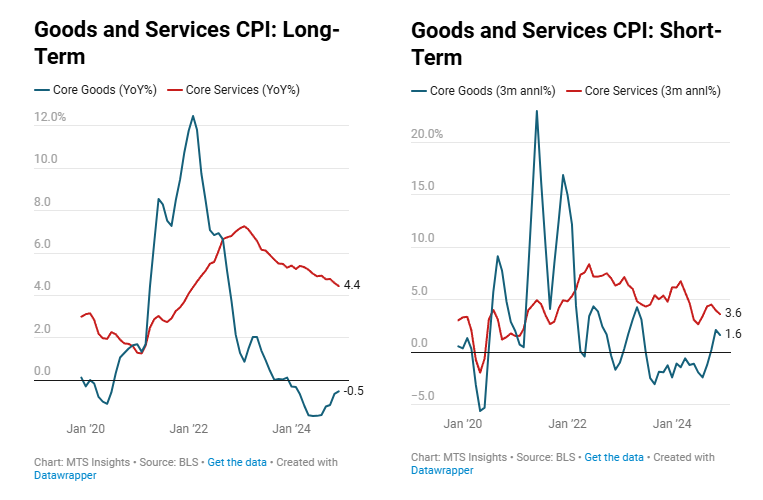
- Core goods prices increased 0.3% MoM in August, the largest monthly print since January and the third straight moderate increase in a row. The subsegments in core goods saw uneven moves with the largest growth in apparel (+0.5% MoM), transportation goods (+0.5% MoM), alcohol (+0.6% MoM), and tobacco (+1.0% MoM). These were partially offset by declines or weak gains in medical care goods (-0.3% MoM), education & communication goods (-0.3% MoM), and household furnishings (+1.0% MoM).
- While the goods segments were about even, with some weak and some strong, the more heavily weighted components related to autos posted strong gains: new vehicles (+0.3% MoM), used vehicles (+1.0% MoM), and auto parts & equipment (+0.6% MoM). While the rise in new vehicle prices was the smallest of the three, it was the largest increase in this subsegment so far this year.
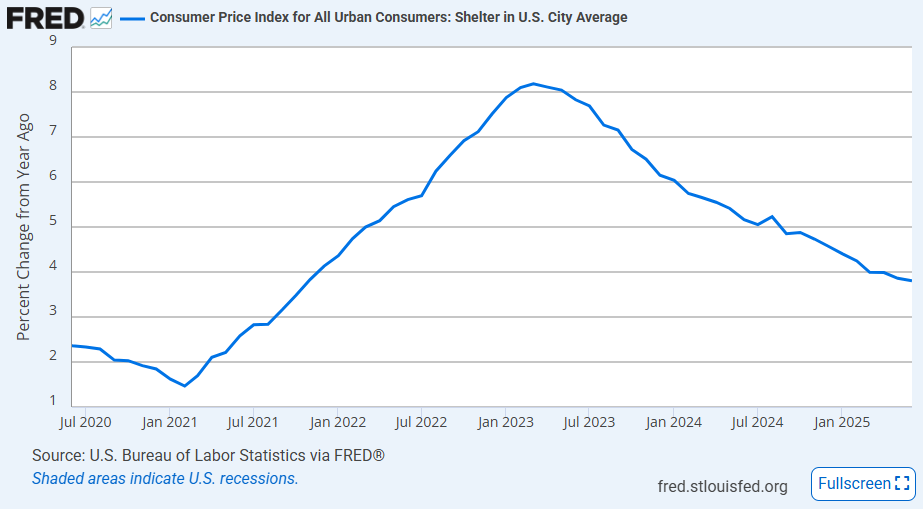
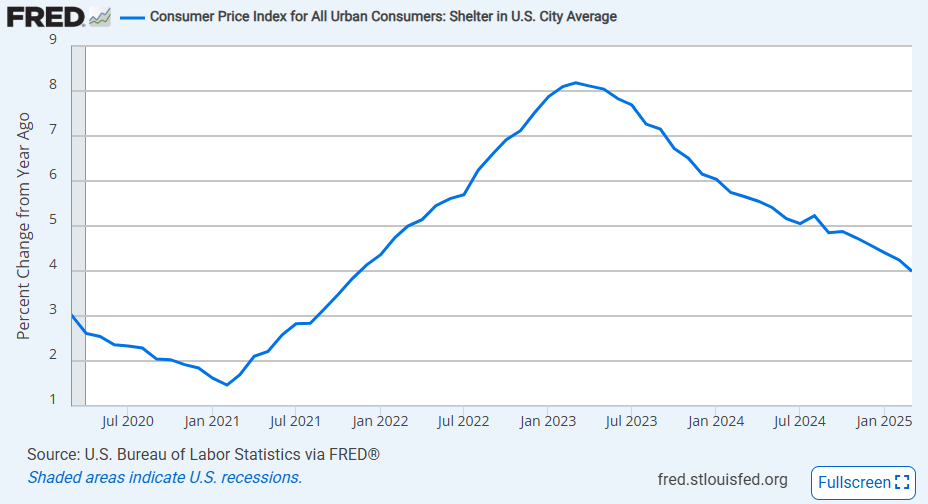
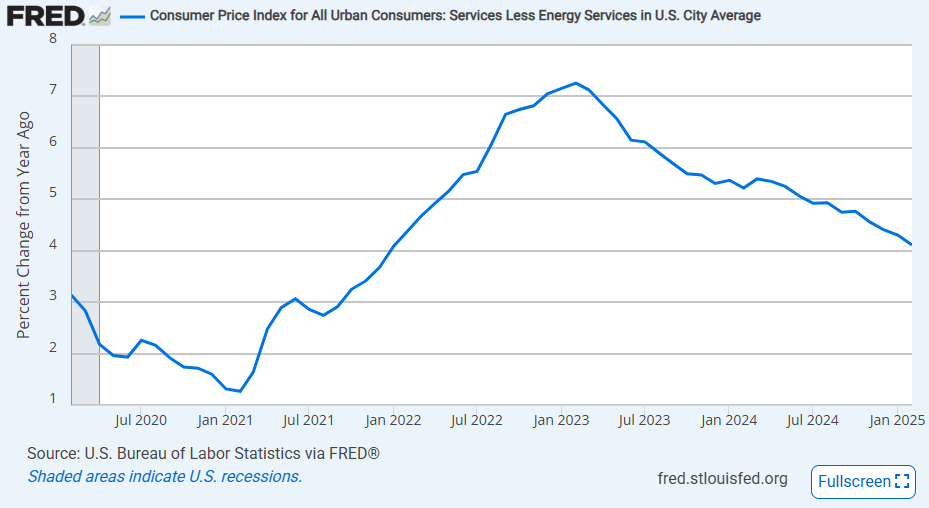
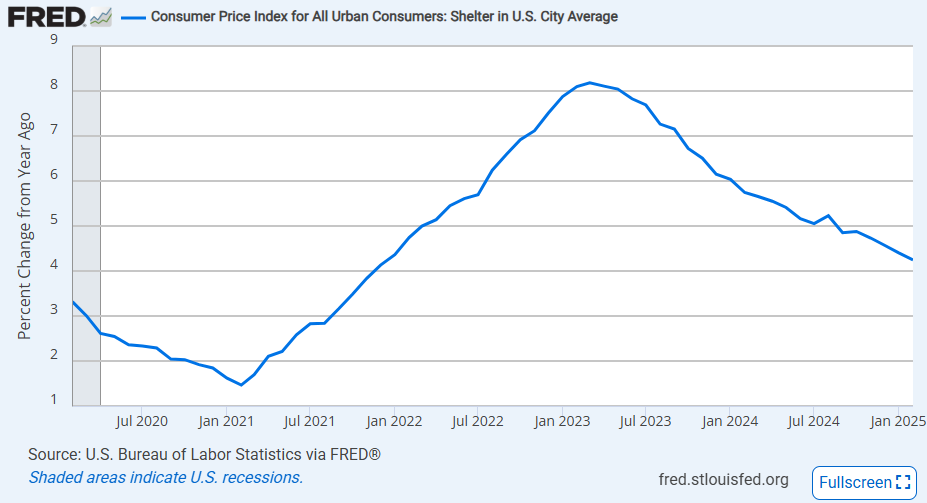
- Core services prices were up 0.3% MoM in August, slightly slower than the 0.4% MoM rise in July. Like the goods subsegments, there were mixed trends among the services subsegments. The heavily weighted shelter index increased 0.4% MoM, its largest rise since January, and was a major driver of the top-line services rise. Outside of that, transportation services (+1.0% MoM) saw a hot print due to the largest ever rise in motor vehicle maintenance prices (+2.4% MoM). These two hotter prints were offset by medical care services (-0.1% MoM), recreation services (-0.2% MoM), and education & communication services (+0.1% MoM).
- This month’s inflation data appears to have been heavily affected by strong moves in subindexes related to autos and the shelter index. When excluding shelter and used cars from core CPI, the monthly increase was 0.2% MoM, in line with the smaller rises in Q1 and Q2.
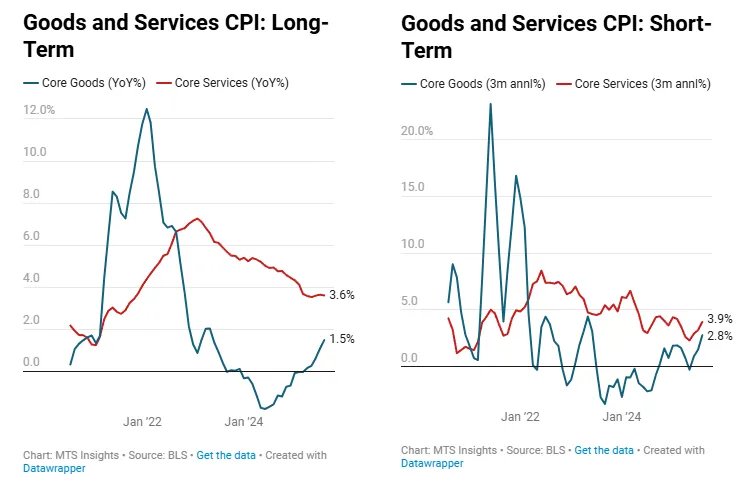
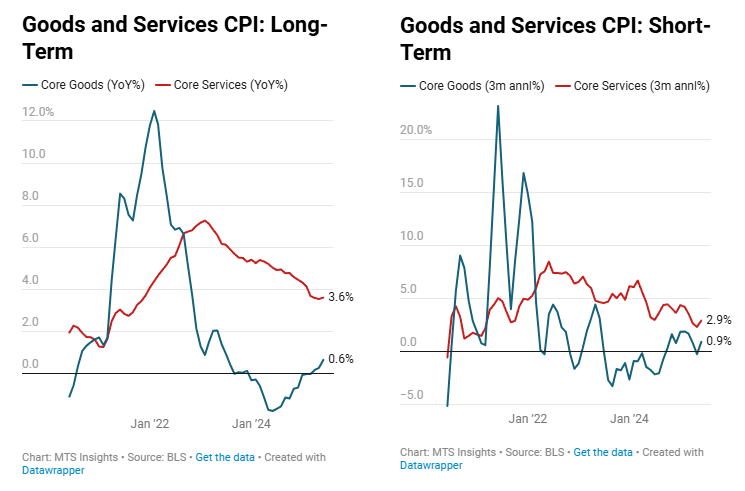
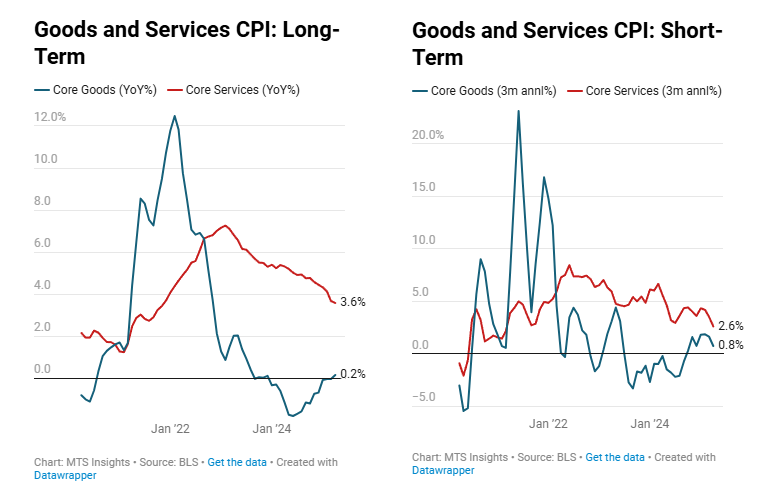
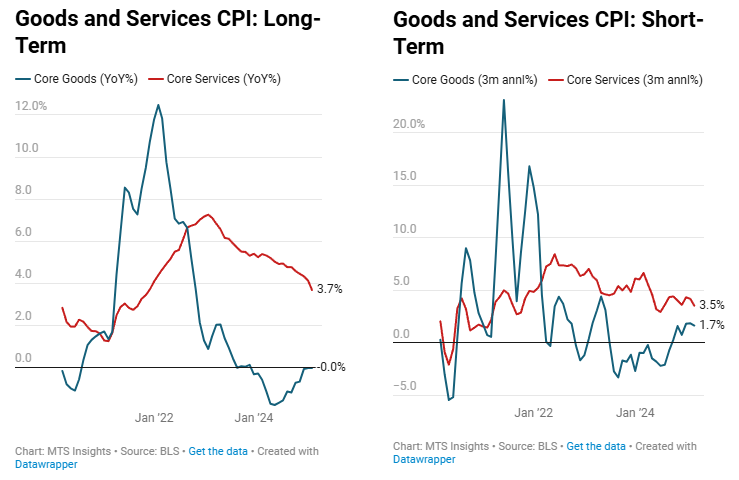
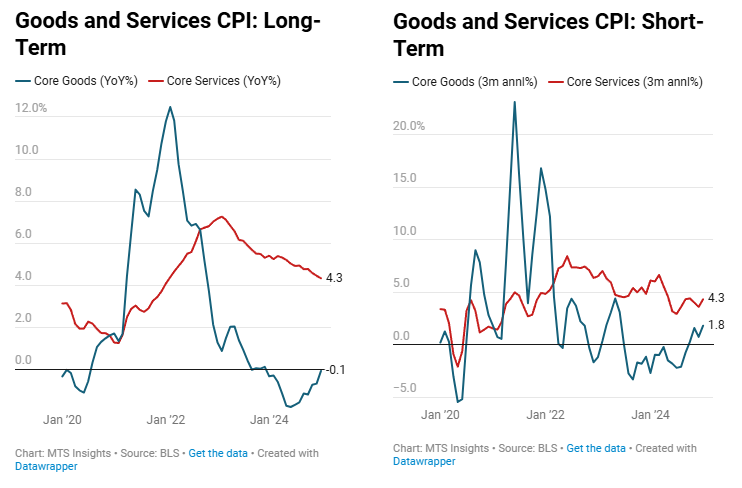
Looking at some broader trends, we can see where the inflationary pressures are coming from. The core goods segment has seen significant gains in the last few months with both the long-term and short-term views showing momentum gathering. Specifically, the 3-month annualized rate of core goods inflation jumped to 2.8% last month, after briefly dropping below zero in May. This is the highest short-term inflationary pressure in goods since mid-2023. The annual increase has also crept higher, rising to 1.5% YoY, the highest since May 2023. The decline in price growth in services has not been enough to offset the resurgence in goods inflation, and in fact, the disinflation in the short-term has bounced back in the last three months to a 3-month annualized rate of 3.9%.