US Construction Spending
- Source
- Census Bureau
- Source Link
- https://www.census.gov/
- Frequency
-
Monthly
1st business day
- Next Release(s)
- February 2nd, 2026 10:00 AM
-
March 2nd, 2026 10:00 AM
-
April 1st, 2026 10:00 AM
-
May 1st, 2026 10:00 AM
-
June 1st, 2026 10:00 AM
-
July 1st, 2026 10:00 AM
-
August 3rd, 2026 10:00 AM
-
September 1st, 2026 10:00 AM
-
October 1st, 2026 10:00 AM
-
November 2nd, 2026 10:00 AM
-
December 1st, 2026 10:00 AM
Latest Updates
-
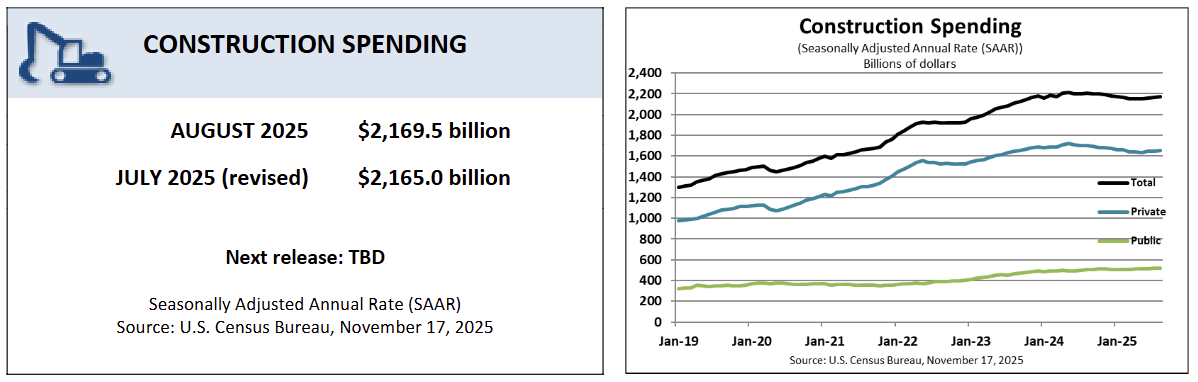
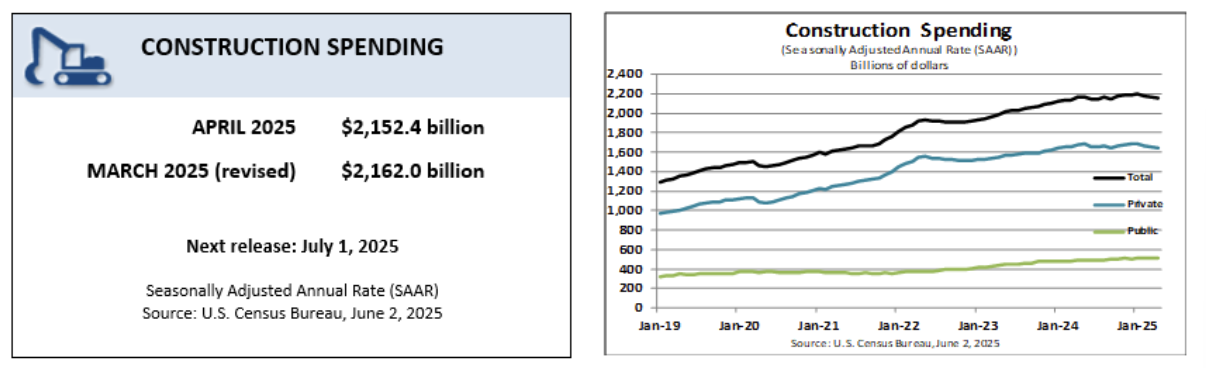
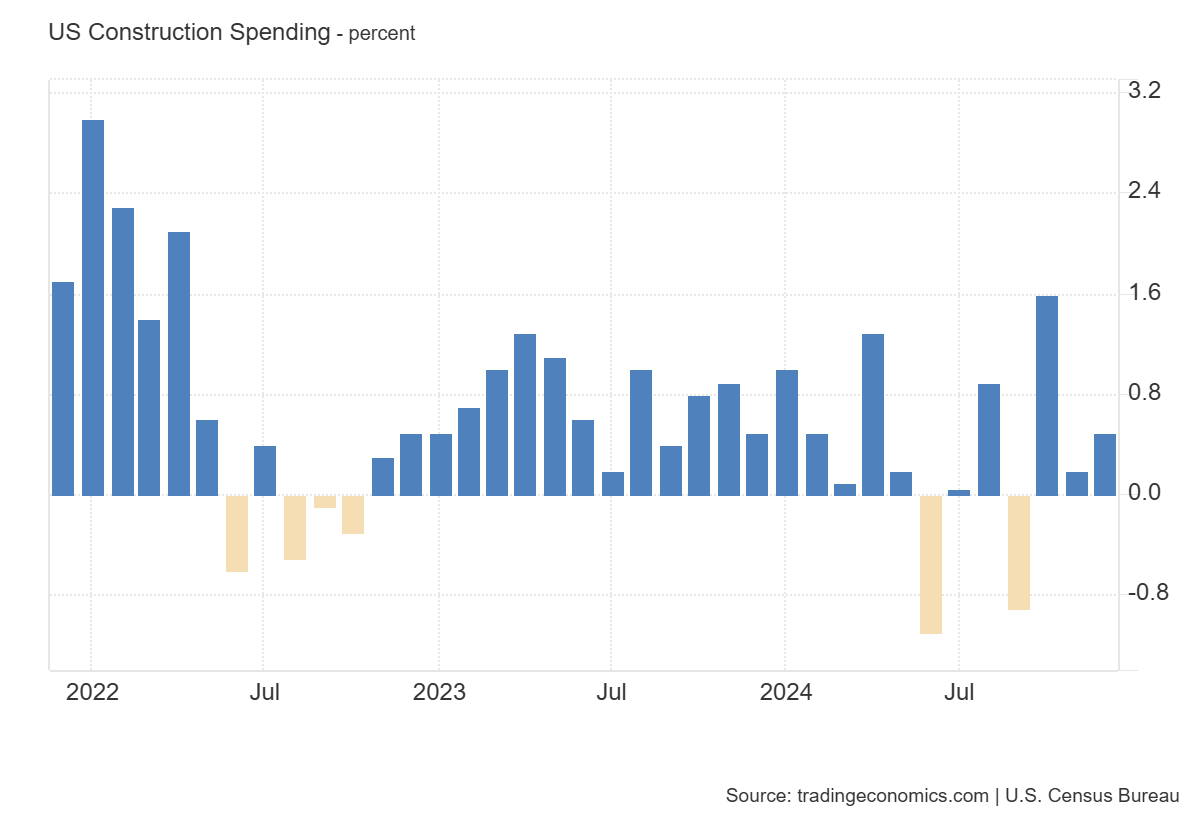
U.S. construction spending rose +0.5% MoM in October 2025 but fell -1.0% YoY, showing modest monthly growth amid a softer annual trend.
-
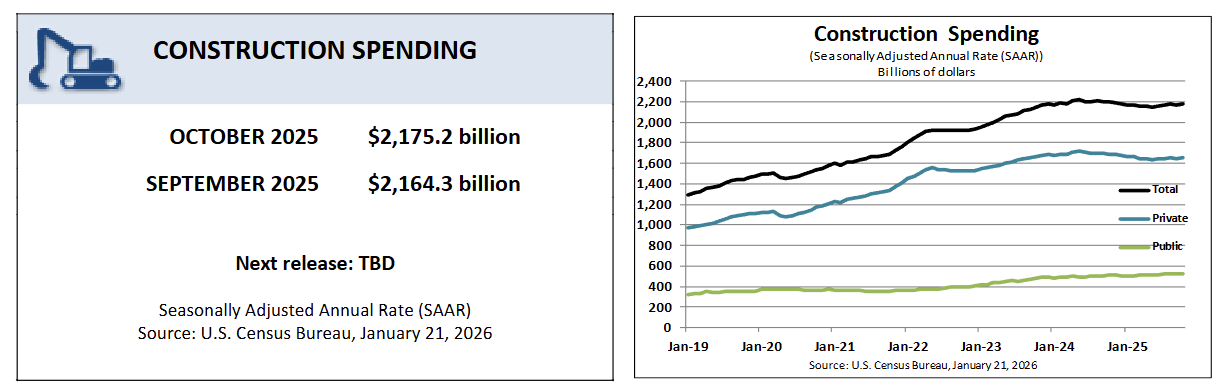
Total construction spending increased to a $2,175.2B SAAR in October (Sep: $2,164.3B), reflecting a +0.5% MoM gain.
-
On a YoY basis, total spending was down -1.0% versus October 2024 ($2,197.1B), indicating overall activity remained below last year’s pace.
-
Year-to-date construction spending totaled $1,825.3B over the first 10 months of 2025, down -1.4% YoY compared with the same period in 2024 ($1,851.4B), reinforcing the weaker trend for the year overall.
-
Private construction spending rose +0.6% MoM to a $1,651.3B SAAR (Sep: $1,640.8B), accounting for most of the monthly increase.
-
Residential construction spending increased +1.3% MoM to $913.9B SAAR (Sep: $902.3B), indicating stronger housing-related outlays compared with the prior month.
-
Nonresidential private construction spending dipped -0.2% MoM to $737.4B SAAR (Sep: $738.5B), showing slight weakness outside housing.
-
Public construction spending was essentially flat, up +0.1% MoM to $524.0B SAAR (Sep: $523.5B), suggesting limited contribution to the monthly gain.
-
Within public construction, educational spending rose +0.7% MoM to $114.8B SAAR, while highway construction was up +0.1% MoM to $141.6B SAAR, both pointing to small increases in key public categories.
-