US Business Inventories
- Source
- Census Bureau
- Source Link
- https://www.census.gov/
- Frequency
- Monthly
- Next Release(s)
- March 16th, 2026 10:00 AM
-
April 16th, 2026 10:00 AM
-
May 14th, 2026 10:00 AM
-
June 17th, 2026 10:00 AM
-
July 16th, 2026 10:00 AM
-
August 14th, 2026 10:00 AM
-
September 16th, 2026 10:00 AM
-
October 15th, 2026 10:00 AM
-
November 17th, 2026 10:00 AM
-
December 16th, 2026 10:00 AM
Latest Updates
-
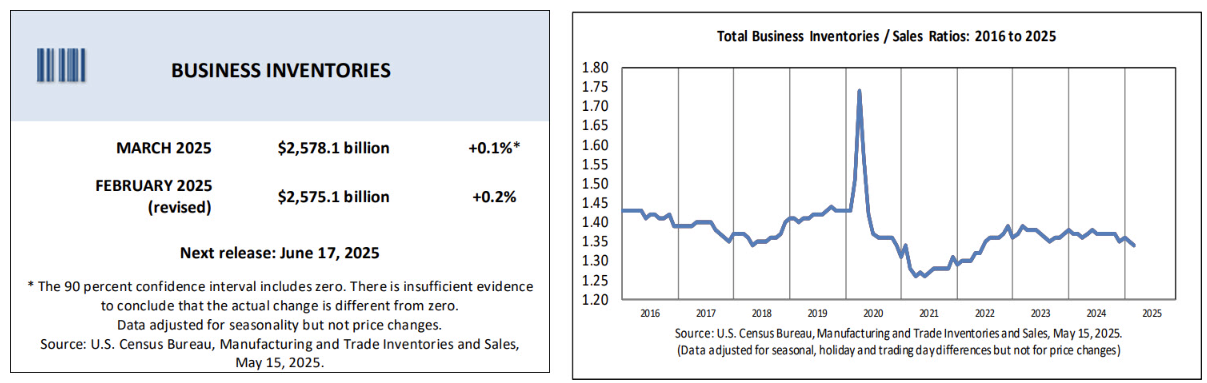
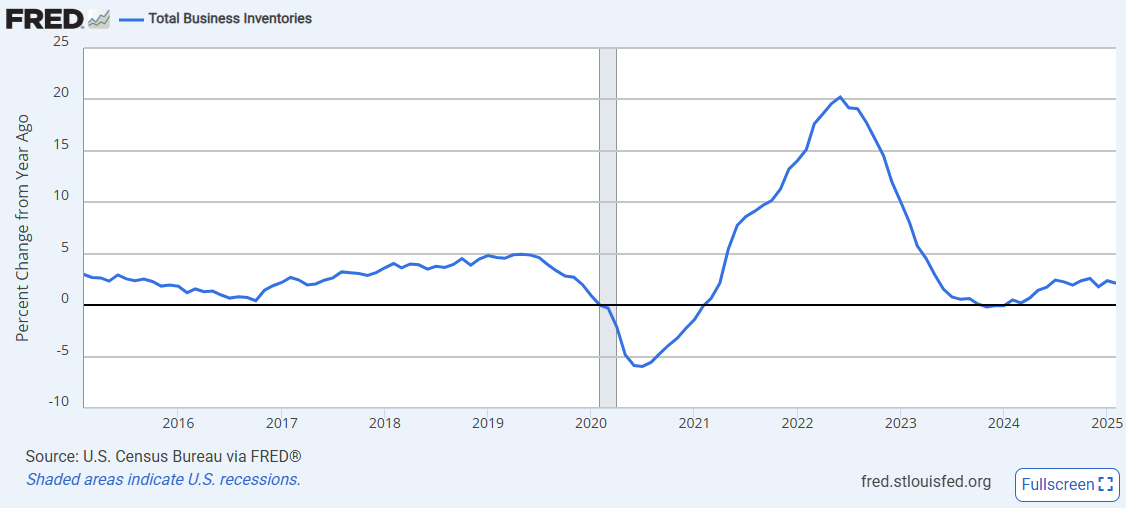
U.S. total business sales rose +0.5% MoM and +3.2% YoY in December 2025 to $1,965.9B, while inventories increased +0.1% MoM and +1.6% YoY, indicating modest stockbuilding alongside continued nominal sales growth.
-
The combined value of distributive trade sales and manufacturers’ shipments increased +0.5% MoM and +3.2% YoY to $1,965.9B in December, following a +0.6% MoM increase in November.
-
Manufacturers’ sales rose +0.5% MoM and +2.2% YoY after declining -0.2% MoM in November, indicating a rebound in shipments at the end of the year.
-
Retailers’ sales were unchanged at 0.0% MoM in December but increased +2.1% YoY, following a +0.5% MoM increase in November.
-
Merchant wholesalers recorded the strongest gains among major sectors, with sales rising +1.0% MoM and +5.2% YoY after a +1.4% MoM increase in November.
-
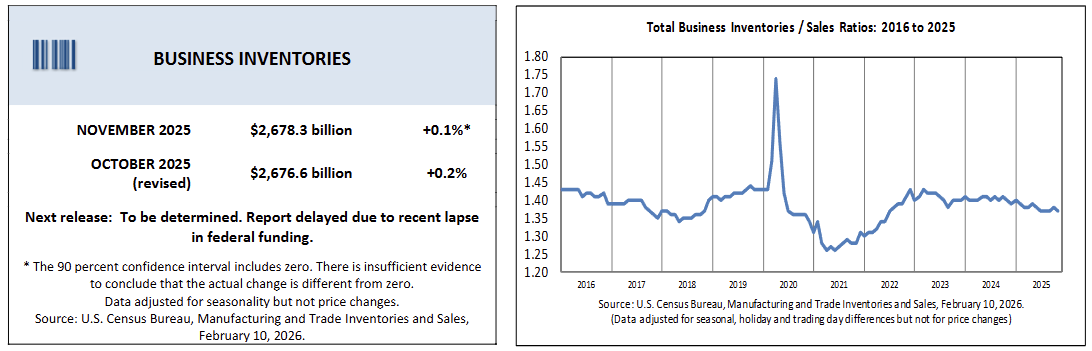
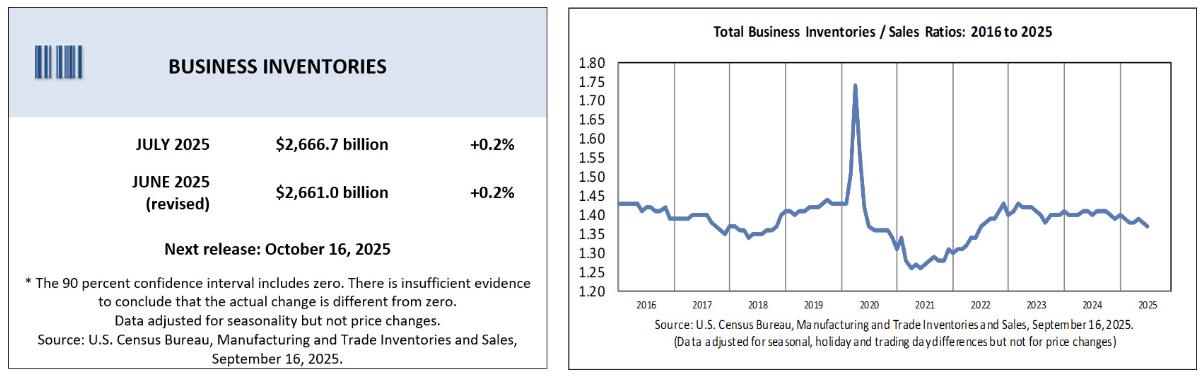
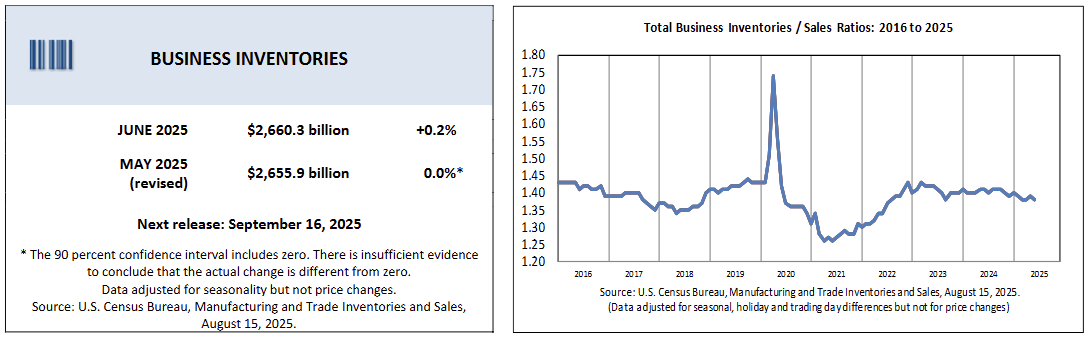
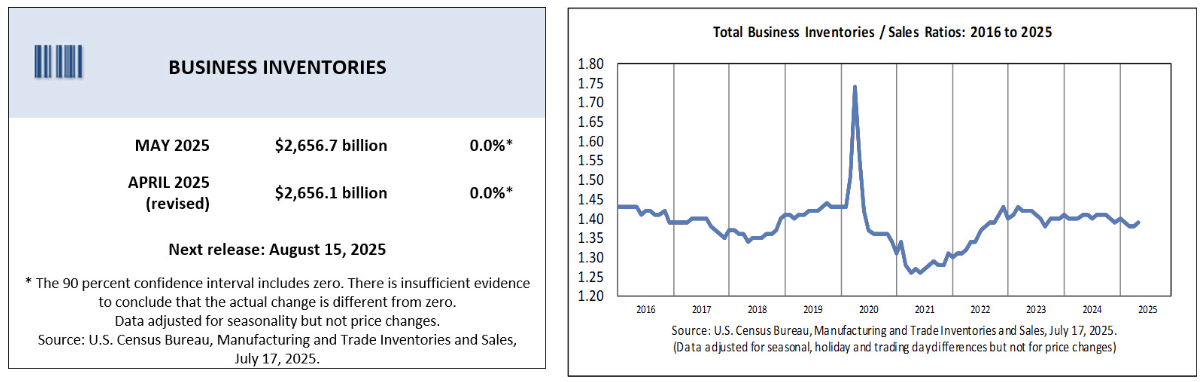
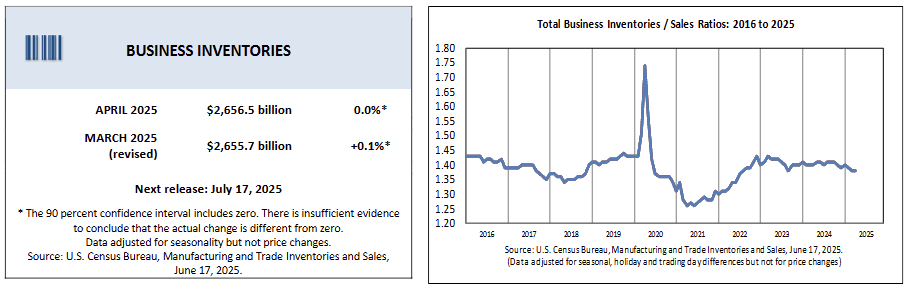
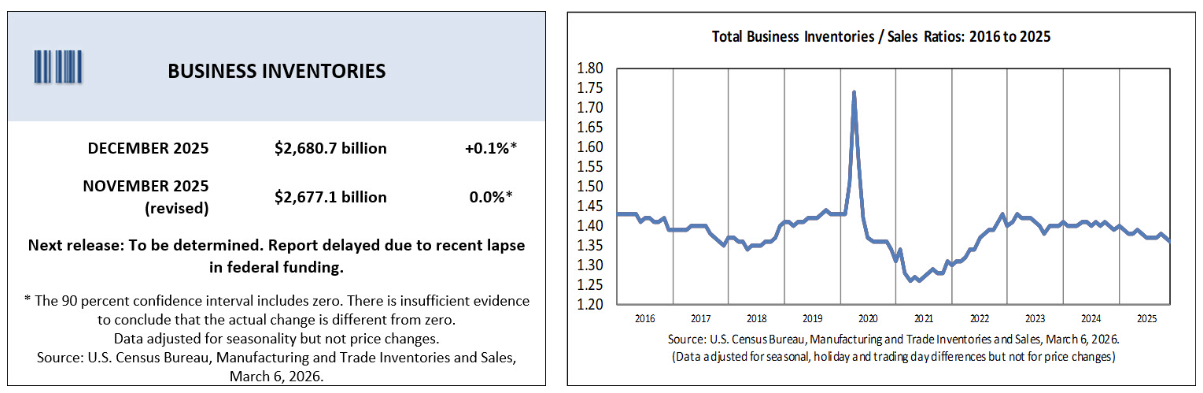
Total business inventories increased +0.1% MoM and +1.6% YoY to $2,680.7B at the end of December, reflecting continued but modest stock accumulation.
-
Manufacturers’ inventories rose +0.1% MoM and +0.9% YoY, while retailer inventories increased +0.1% MoM and +0.9% YoY after a -0.4% MoM decline in November.
-
Merchant wholesaler inventories increased +0.2% MoM and +2.9% YoY, indicating faster inventory accumulation in the wholesale sector relative to other industries.
-
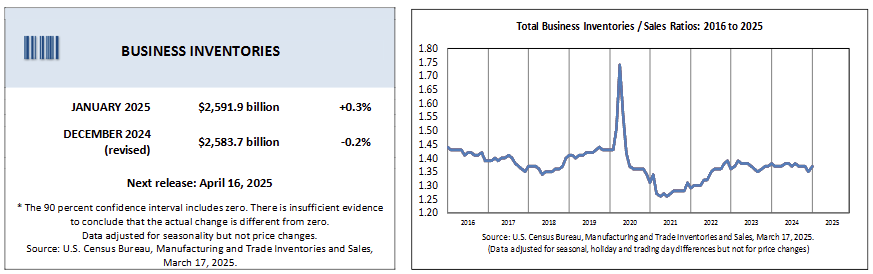
The total business inventories-to-sales ratio declined to 1.36 in December from 1.39 a year earlier, showing inventories remained leaner relative to sales compared with December 2024.
-