US Business Formations
- Source
- Census Bureau
- Source Link
- https://www.census.gov/
- Frequency
- Monthly
- Next Release(s)
- October 8th, 2025 10:00 AM
-
November 13th, 2025 10:00 AM
-
December 12th, 2025 10:00 AM
Latest Updates
-
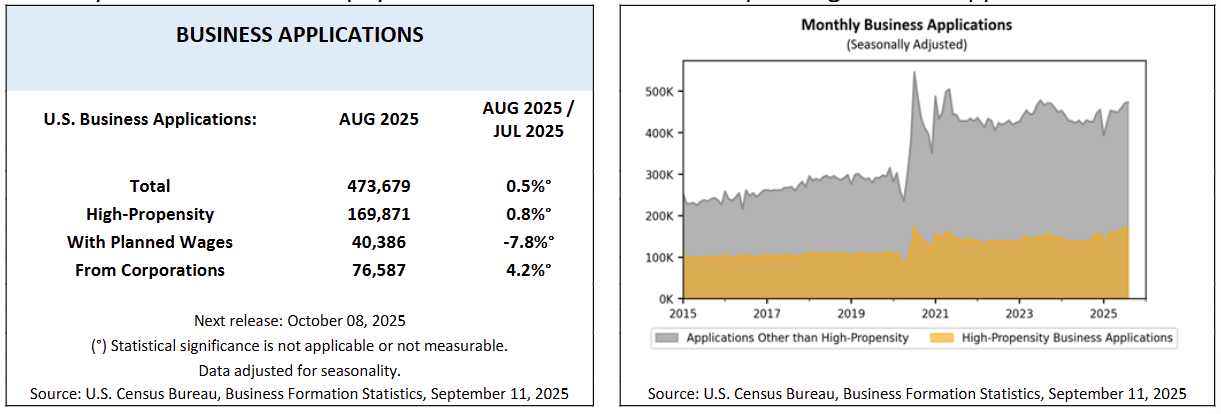
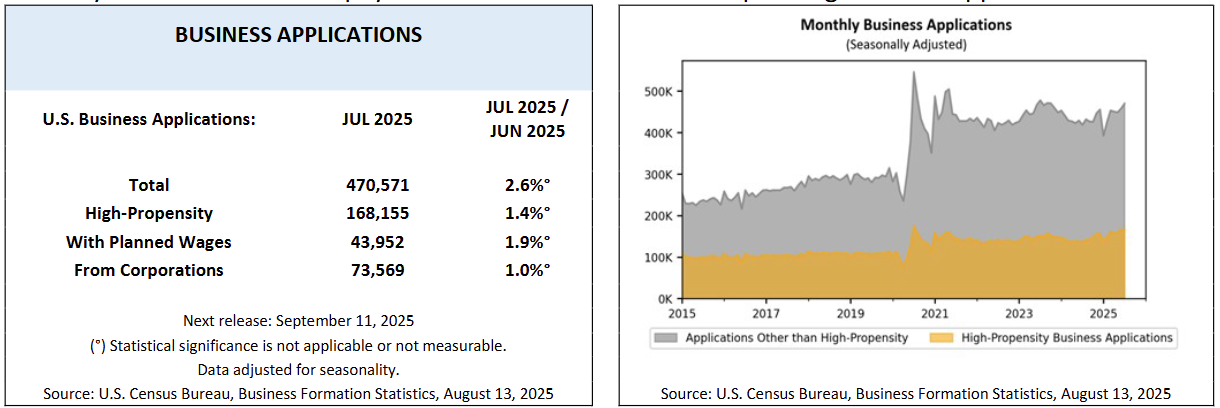
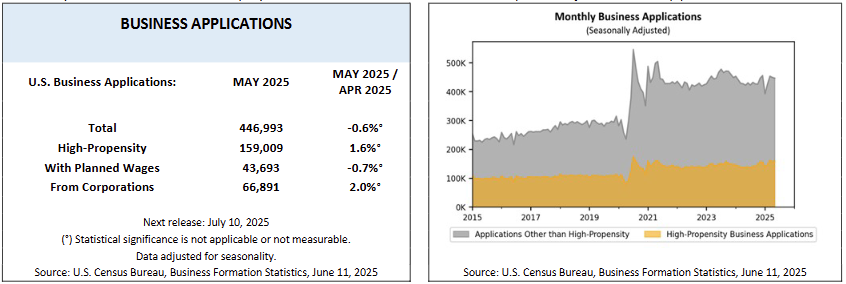
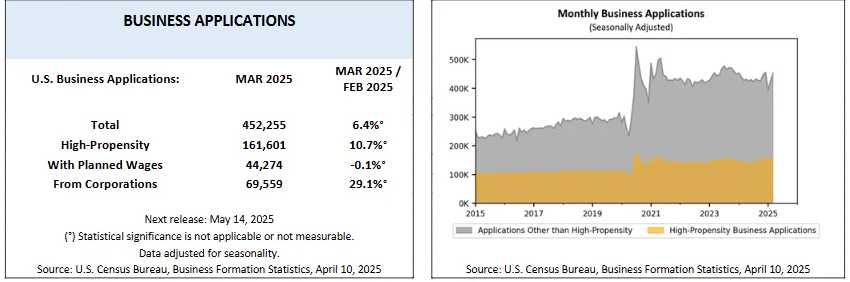
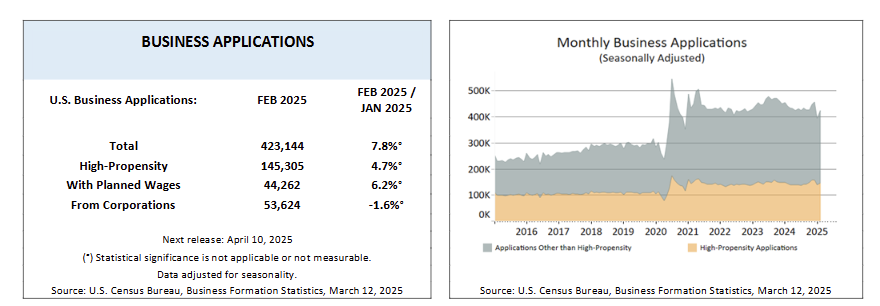
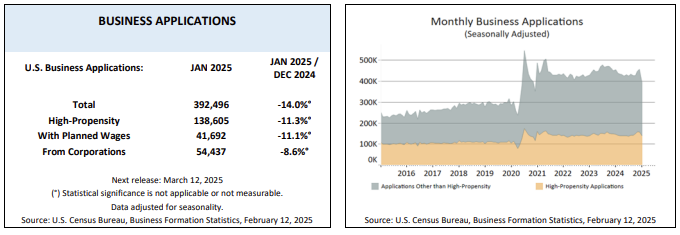
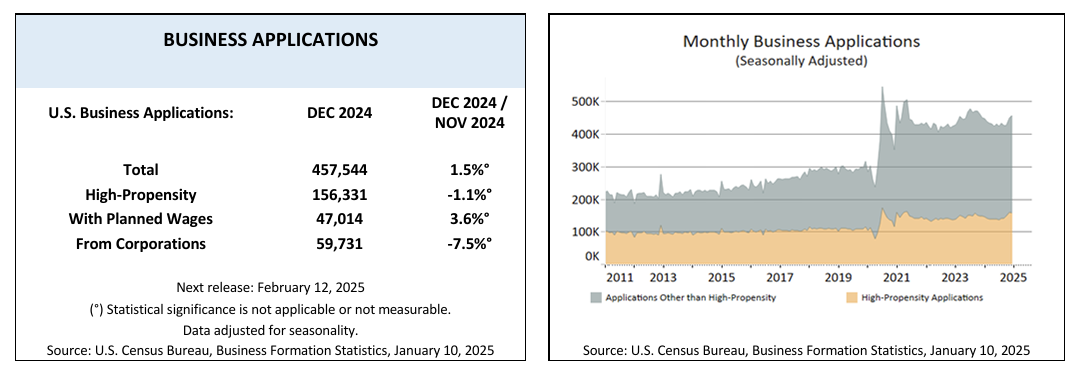
U.S. business applications edged up +0.5% MoM in August 2025 to 473,679, with gains in corporate and high-propensity filings offset by a sharp drop in applications with planned wages.
-
High-propensity applications rose +0.8% MoM to 169,871, signaling a modest rise in firms with strong potential for growth.
-
Applications with planned wages fell -7.8% MoM to 40,386, the steepest decline across categories, pointing to fewer businesses planning payrolls at the outset.
-
Corporate applications increased +4.2% MoM to 76,587, their strongest gain since early 2025.
-
Regionally, the Midwest (+1.9% MoM) and South (+1.0% MoM) led total applications, while the West (-1.2% MoM) posted the only regional decline.
-
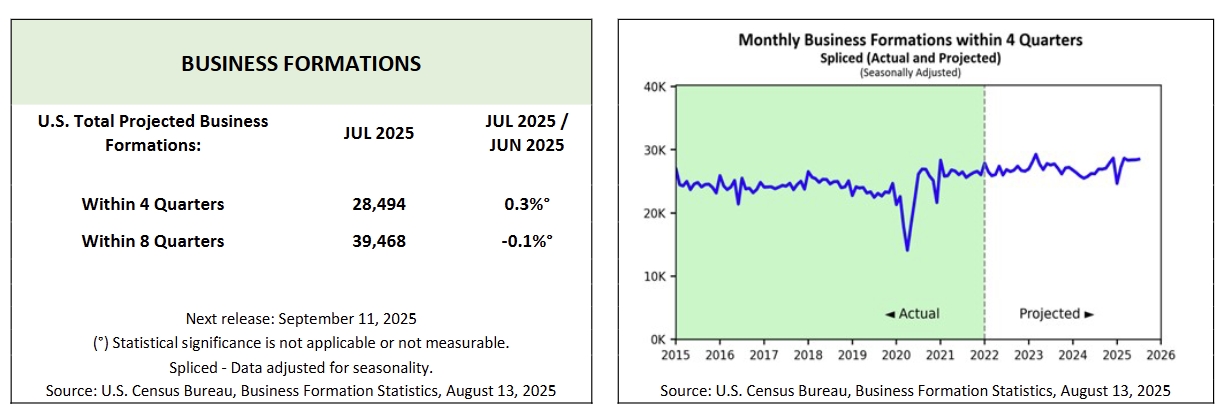
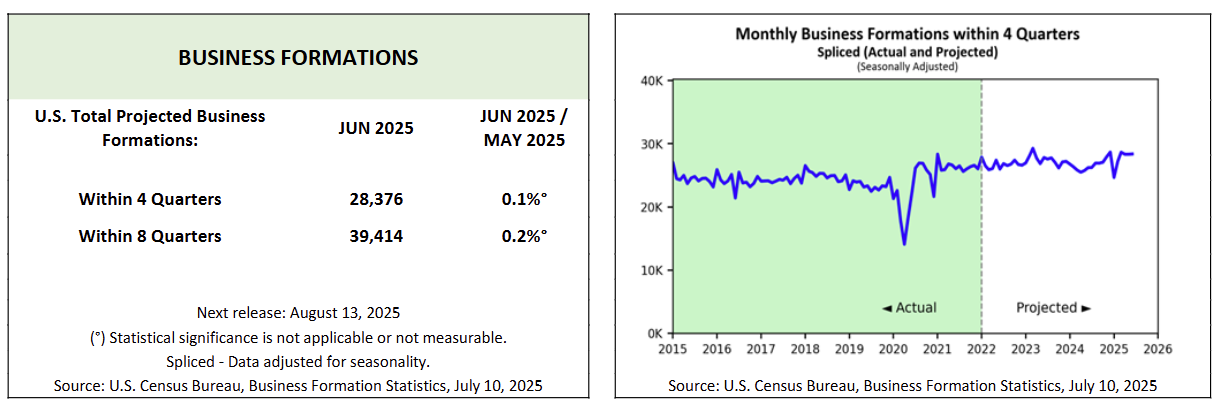
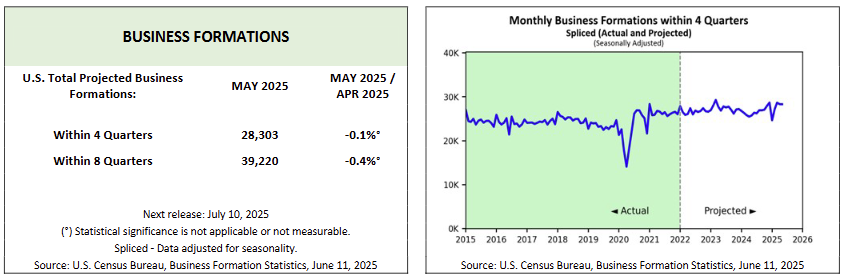
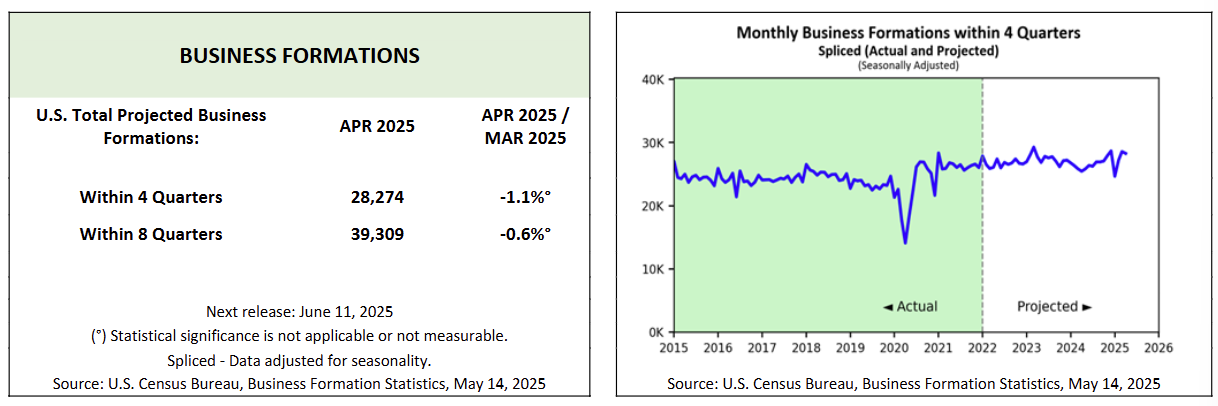
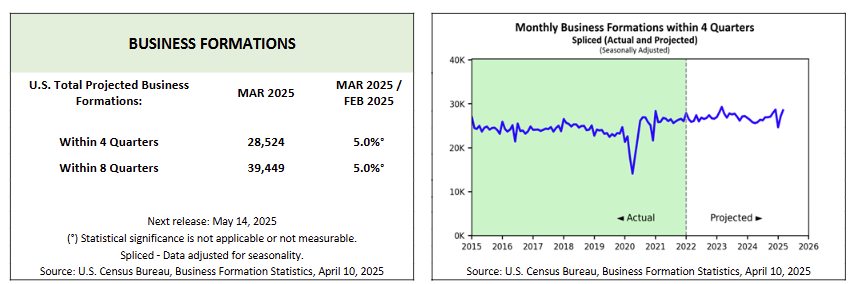
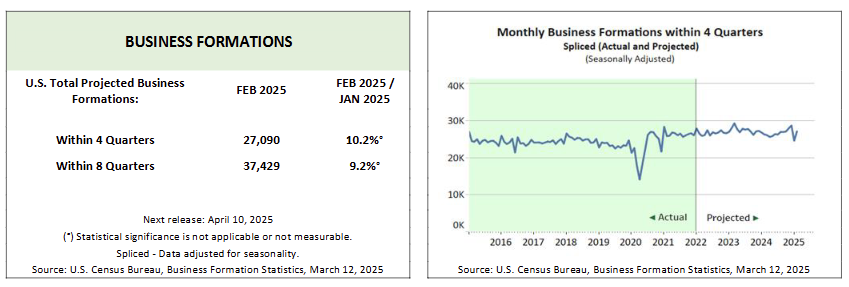
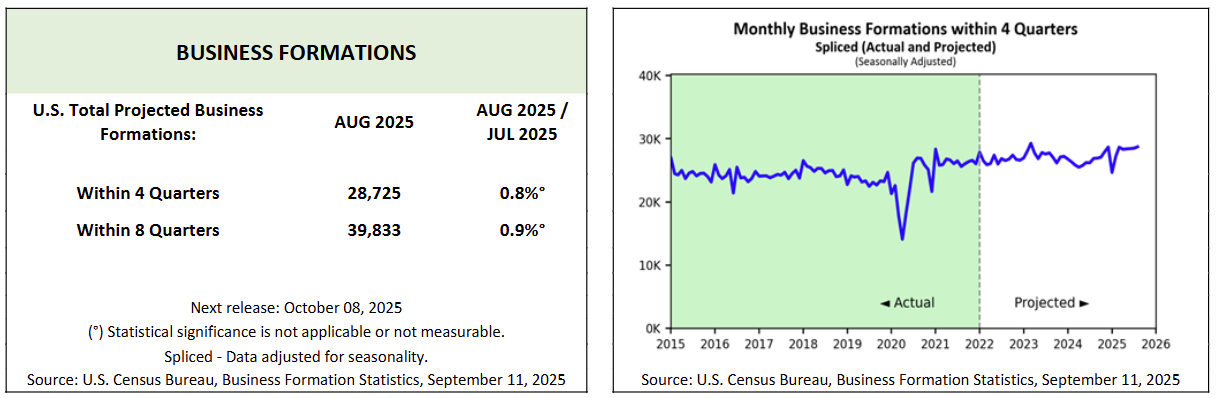
Projected business formations within 4 quarters rose +0.8% MoM to 28,725, while 8-quarter projections gained +0.9% MoM to 39,833, with the South driving the increases.
-
By industry, construction (+20.7% MoM), agriculture (+4.6% MoM), and accommodation & food services (+2.5% MoM) posted the largest gains, while mining (-6.4% MoM), arts & entertainment (-2.5% MoM), and real estate (-2.2% MoM) declined.
-