
 UK CPI
- Source
- ONS
- Source Link
- https://www.ons.gov.uk/
- Frequency
- Monthly
- Next Release(s)
- September 17th, 2025 2:00 AM
Latest Updates
-
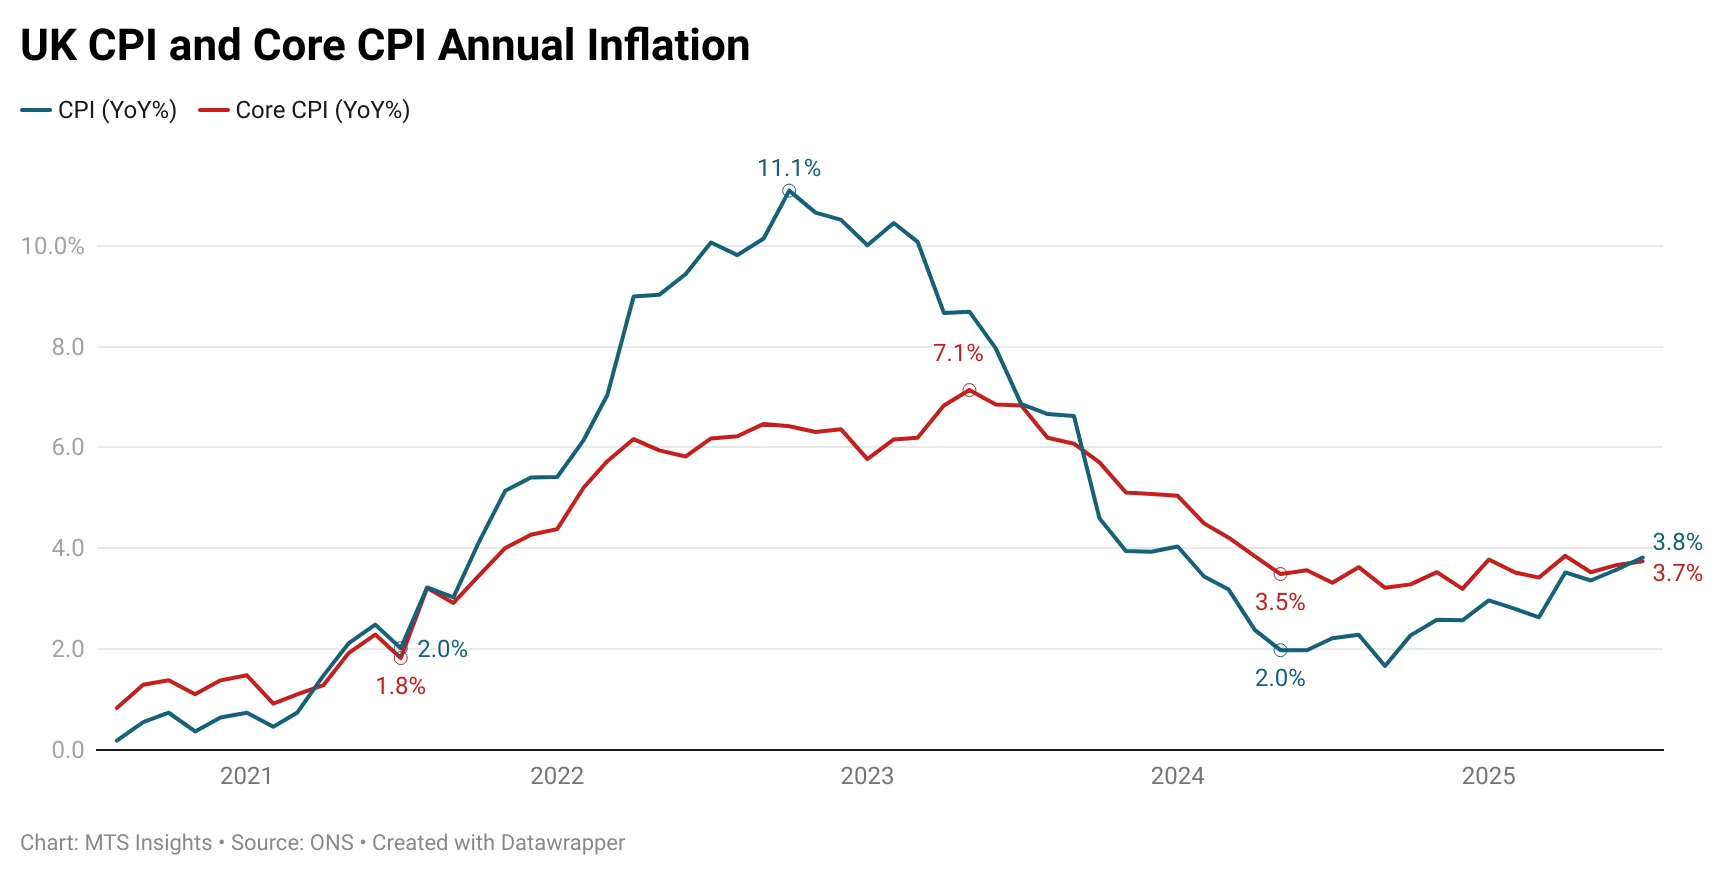
UK CPI rose 0.1% MoM in July and accelerated to 3.8% YoY (from 3.6% YoY in June), surprising to the upside and reaching its highest rate since January 2024.
-
Core CPI increased 0.2% MoM and 3.8% YoY (up from 3.7% YoY), driven largely by stronger services prices, which rose 0.7% MoM and 5.0% YoY.
-
Energy prices turned positive for the first time since June 2023, up 1.4% YoY, helped by base effects and a 2.0% MoM jump in fuel prices.
-
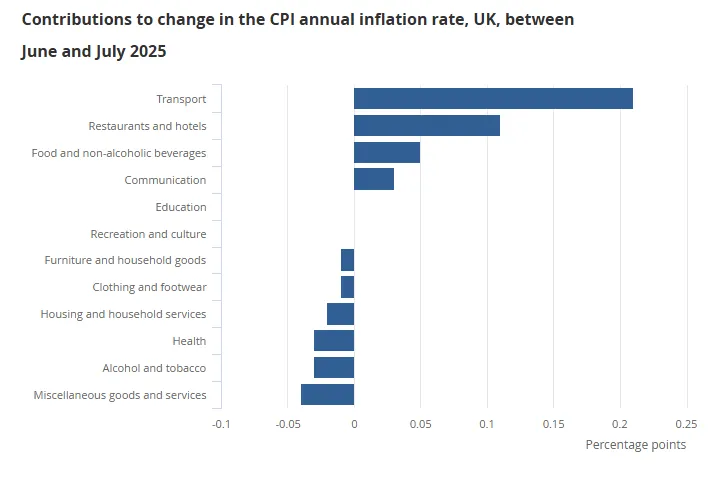
Food and non-alcoholic beverages rose 0.2% MoM and 4.9% YoY, contributing 0.55 ppts to headline inflation — the highest contribution since January.
-
Within core services, airfares surged 30.2% MoM, lifting the transport contribution to 0.44 ppts, while restaurants & hotels rose 0.4% MoM, pushing that segment’s annual rate to 3.4% YoY.
-
Markets initially reacted hawkishly (higher yields and stronger GBP), but later pared back as investors viewed much of the upside as driven by volatile components.
-
-
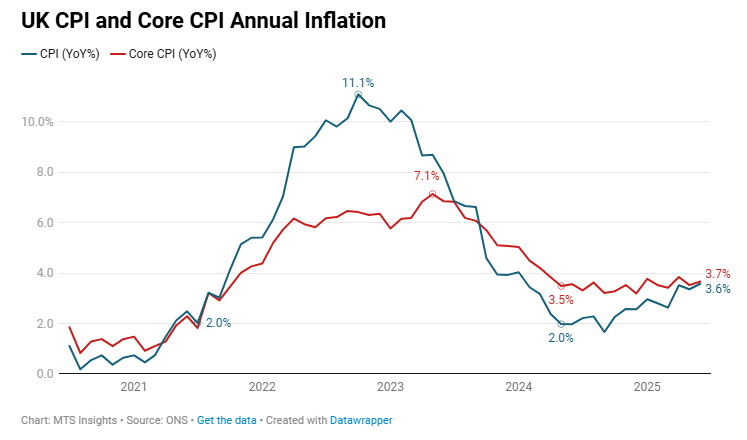
UK CPI inflation rose to 3.6% YoY (vs 3.4% YoY expected) in June 2025, up from 3.4% YoY in May, with the monthly rate accelerating to 0.3% MoM (vs 0.2% MoM expected).
- Core CPI rose 0.4% MoM (vs 0.2% MoM expected) and 3.7% YoY (vs 3.5% YoY expected), up from 3.5% YoY and 0.2% MoM in May.
- Services prices increased 0.6% MoM, matching the monthly increase in June 2024, and the annual change remained at 4.7% YoY.
- Goods prices were flat in June, ahead of a -0.3% MoM drop in June 2025, and the annual change accelerated 0.4 ppts to 2.4% YoY.
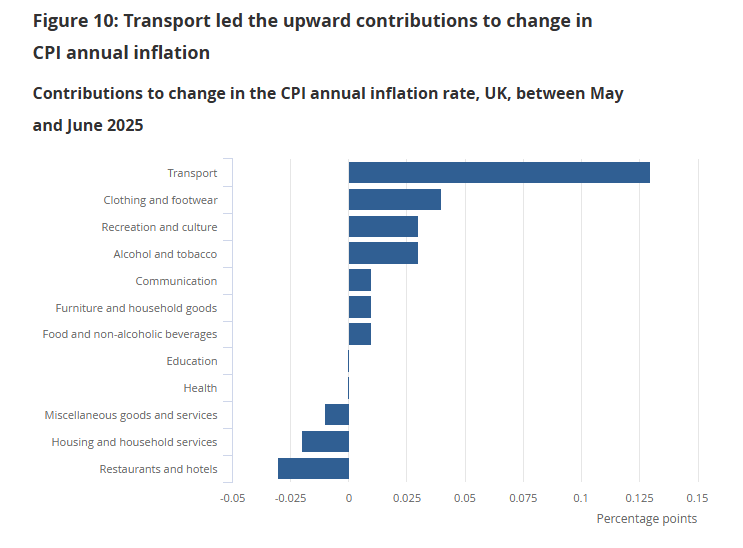
- Transport inflation jumped to 1.7% YoY (from 0.7% YoY) and 0.7% MoM, driven by higher fuel prices. The segment was the largest contributor to the increase in the annual CPI rate from May to June.
- Alcohol and tobacco inflation accelerated to 6.4% YoY, up from 5.4% YoY in May, as the segment increased 0.5% MoM compared to a -0.4% MoM in June 2024.
- Clothing and footwear prices remained soft, up just 0.5% YoY and down -0.4% MoM (the only segment posting a monthly decline in June).
-
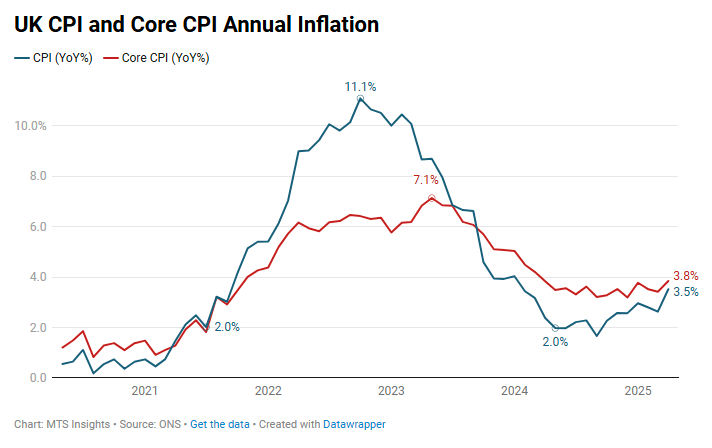
UK CPI inflation was 3.4% YoY in May, down slightly from 3.5% YoY in April and in line with expectations. Monthly inflation eased to 0.2% MoM from 0.3% MoM in May 2024.
- Core CPI slowed to 0.2% MoM and 3.5% YoY from 3.8% YoY in April, below expectations of a 3.6% YoY reading.
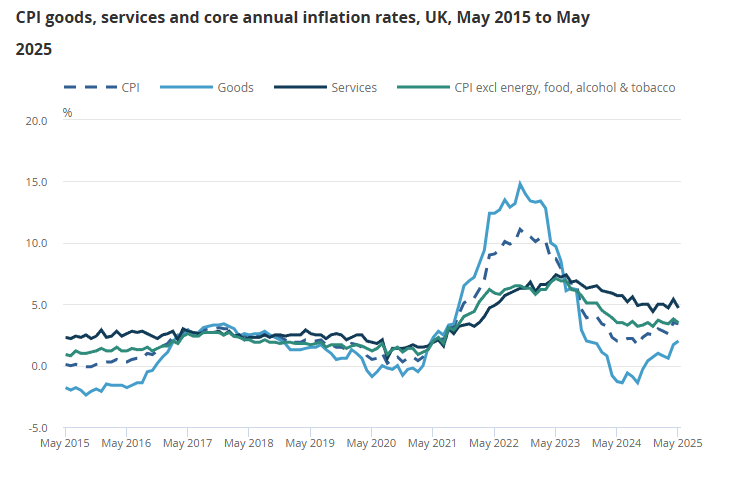
- Goods inflation rose to 2.0% YoY (highest since November 2023), up from 1.7% YoY in April, with the monthly rate at 0.4% MoM vs flat a year ago.
- Services inflation decelerated to 4.7% YoY in May from 5.4% YoY in April. On a monthly basis, services prices dropped -0.1% MoM, much cooler than the 0.6% MoM increase a year ago.
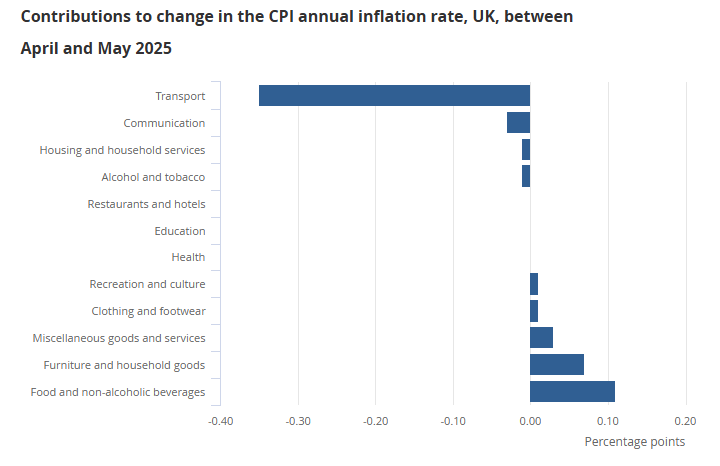
- The largest downward contribution came from transport prices, down -1.8% MoM. Air fares fell by 5.0% MoM between April and May 2025, compared with a large rise of 14.9% MoM between the same months in 2024. These movements were influenced by the timing of Easter and the associated school holidays.
- Upward pressure came from food and non-alcoholic beverages (+0.7% MoM, 4.4% YoY), clothing and footwear (+0.8% MoM, -0.3% YoY), and furniture and household goods (+1.5% MoM, 0.8% YoY).
- The softening in core and services inflation suggests some easing in underlying price pressures despite lingering volatility in food and goods prices.
-
UK inflation rebounded sharply in April, as rising household utility bills and holiday travel costs drove the annual rate to the highest since early 2024. Underlying price pressures flipped from being a bit softer in March to a hotter-than-expected monthly rise in April. The surprise uptick may complicate the Bank of England’s efforts to keep inflation under control while it looks for ways to support the economy which faces growth concerns from global trade tensions.
CPI and Key Segments
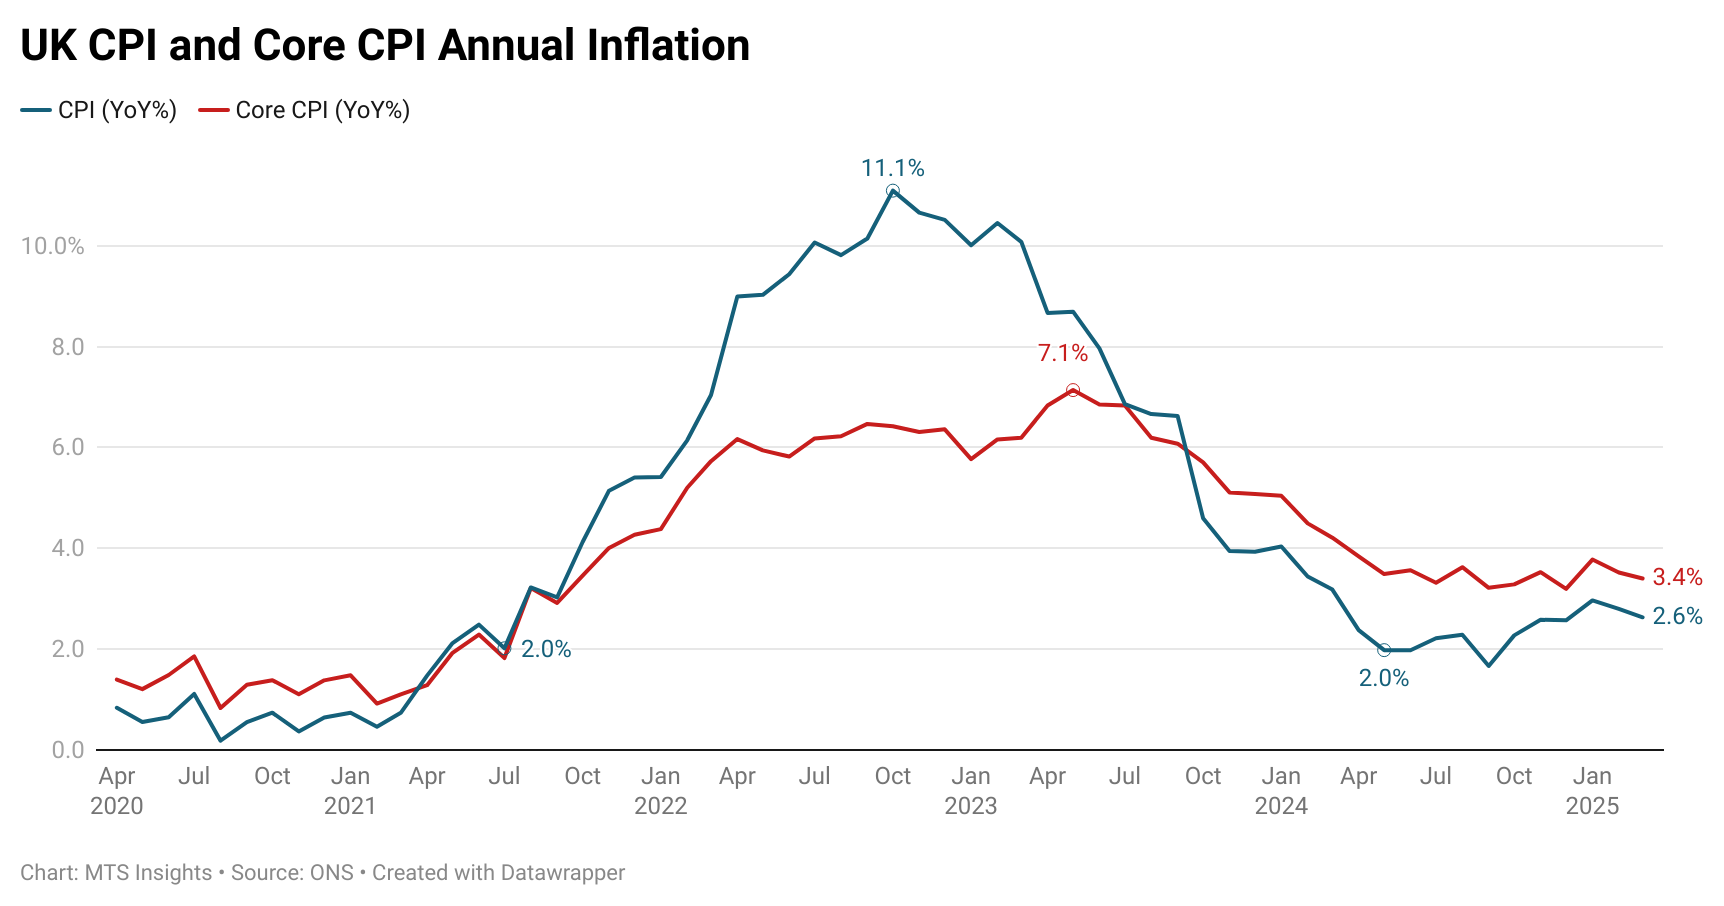
The headline CPI index increased 1.2% MoM in April, pushing the annual inflation to 3.5% YoY and topping expectations of increases of 1.1% MoM and 3.3% YoY. This acceleration follows a much weaker March’s 2.6% YoY increase which looked like a signal that disinflation was finally happening. Instead, in April we see the annual rate rise to the highest since January 2024, reflecting both hot monthly gains and strong base effect from last year’s price dynamics. Indeed, a key factor was that the 1.2% MoM increase in April 2025 was much stronger than the April 2024’s rise of 0.3% MoM. Let’s look at some key segments:
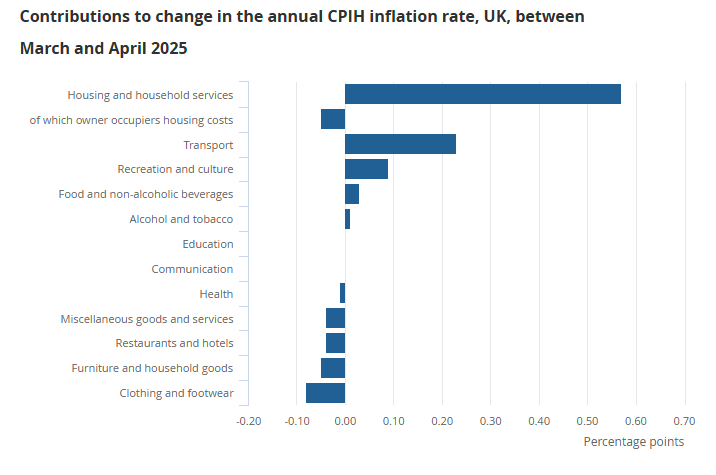
- Housing and utility costs were the single largest driver of April’s inflation surge. The housing and household services segment (which includes electricity, gas, and other fuels, as well as water supply and other utilities) saw prices rise 3.3% MoM and 7.8% YoY in April, up from 1.8% YoY in March. Not only was there a hot monthly rise, but base effects made the jump even more impactful as it compared to a -2.5% MoM drop in April 2024. The steep gain this year reflects increases in household energy bills. Notably, Britain’s energy regulator Office of Gas and Electricity Markets (Ofgem) raised its price cap by 6.4% from April, which immediately fed through to higher electricity and gas prices.
- Transport costs were another major contributor to the reheating of inflation. The segment was up 3.8% MoM in April (vs a rise of 1.7% MoM in April 2024), pushing the annual rate to 3.3% YoY from a much smaller 1.2% YoY increase in March. The surge was driven especially by an Easter-related rise in air travel prices which had airfares up 27.5% MoM in April (the rise of just 6.5% MoM in the same month a year ago). Indeed, the ONS points out that this was the 2nd highest monthly rise ever recorded for the airfare subindex. In addition to the rise in air travel costs, the government’s vehicle excise duty (VED) increase in April put upward pressure on the transport segment. Offsetting these hot trends were softer fuel prices. The overall motor fuel index was down -9.3% YoY, a stronger decline than the -5.3% YoY drop in March.
- Alongside the rise in transport costs was a rise in the recreation and culture segment which was up 1.2% MoM and 3.1% YoY (up from 2.4% YoY in March). Just as with air transport, the Easter timing meant that holiday tour prices rose more this April, whereas last year’s index captured Easter holiday costs in March (this may have also explained why March inflation was as soft as it was).
- Not all categories saw price increases, and a few provided downward pressure on the overall inflation rate. The largest offsetting movement came from clothing and footwear, which flipped into deflation, down -1.1% MoM and -0.4% YoY. This was the first negative annual rate for apparel in roughly two years. Similarly, the furniture and household goods segment saw prices ease with drops of -1.7% MoM and -0.5% MoM, as retailers of household appliances, furniture and other home goods kept prices in check or discounted products amid softer demand. Other cooler segments include education (+0.0% MoM) and health (+0.3% MoM).
Core CPI
Stripping out volatile food and energy effects, core CPI inflation in the UK also strengthened in April, underscoring that underlying price momentum remains concerning even though it looked like there might be some cooling in March. Core CPI increased 1.4% MoM and 3.8% YoY, up from 3.4% YoY in March and a strong beat over expectations of core rises of 1.2% MoM and 3.6% YoY. Base effects were evident in core inflation but not as much as the 1.4% MoM April 2025 change compares to an 0.9% MoM April 2024 change. Coincidentally, this renewed pickup brings core inflation back to the highest level in a year, when the annual increase was 3.9% YoY in April 2024. Price growth in core categories had shown tentative signs of cooling in late 2024, but the first months of 2025 have seen core inflation return to and above the mid-3% range.
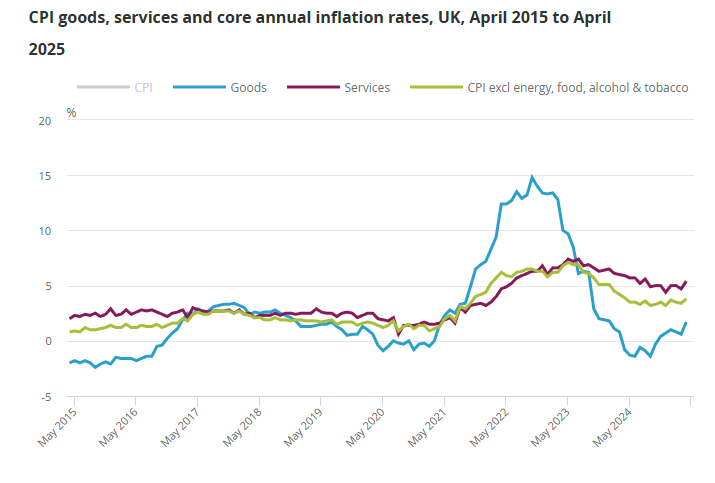
There continues to be a divergence between goods and services inflationary pressures and the release this month demonstrates that clearly.
- Goods inflation remained relatively subdued in April, up just 0.3% MoM, and the annual rate was 1.7% YoY. While this was a notable increase from just 0.6% YoY in March, the acceleration is mostly a result of base effects as the goods index fell -0.8% MoM a month ago. Additionally, the rise in goods inflation was driven largely by the turnaround in energy-related goods prices, so core goods prices were even cooler. The clothing and footwear and household furnishings segments, both components of core CPI inflation, are two that I pointed out were particularly weak in April. Essentially, core goods inflationary pressures is no a longer a primary driver of UK inflation, and it hasn’t been since the post-COVID supply chain crunch.
- On the other hand, services inflation continues to run hot, reflecting more persistent price pressures. The services CPI segment jumped 2.2% MoM in April, and the annual rate accelerated to 5.4% YoY, up from 4.7% in March and the highest since August 2024. Several specific service components linked to tourism saw especially large gains. As discussed, air travel saw an unprecedented surge and the recreational and personal services also rose sharply, both due to the dynamics of the Easter holiday. Some of these factors look temporary, but in fact, they highlight more entrenched economic factors that drive inflationary pressure like high service sector wage growth and consumer finances that are strong enough to support this type of spending.
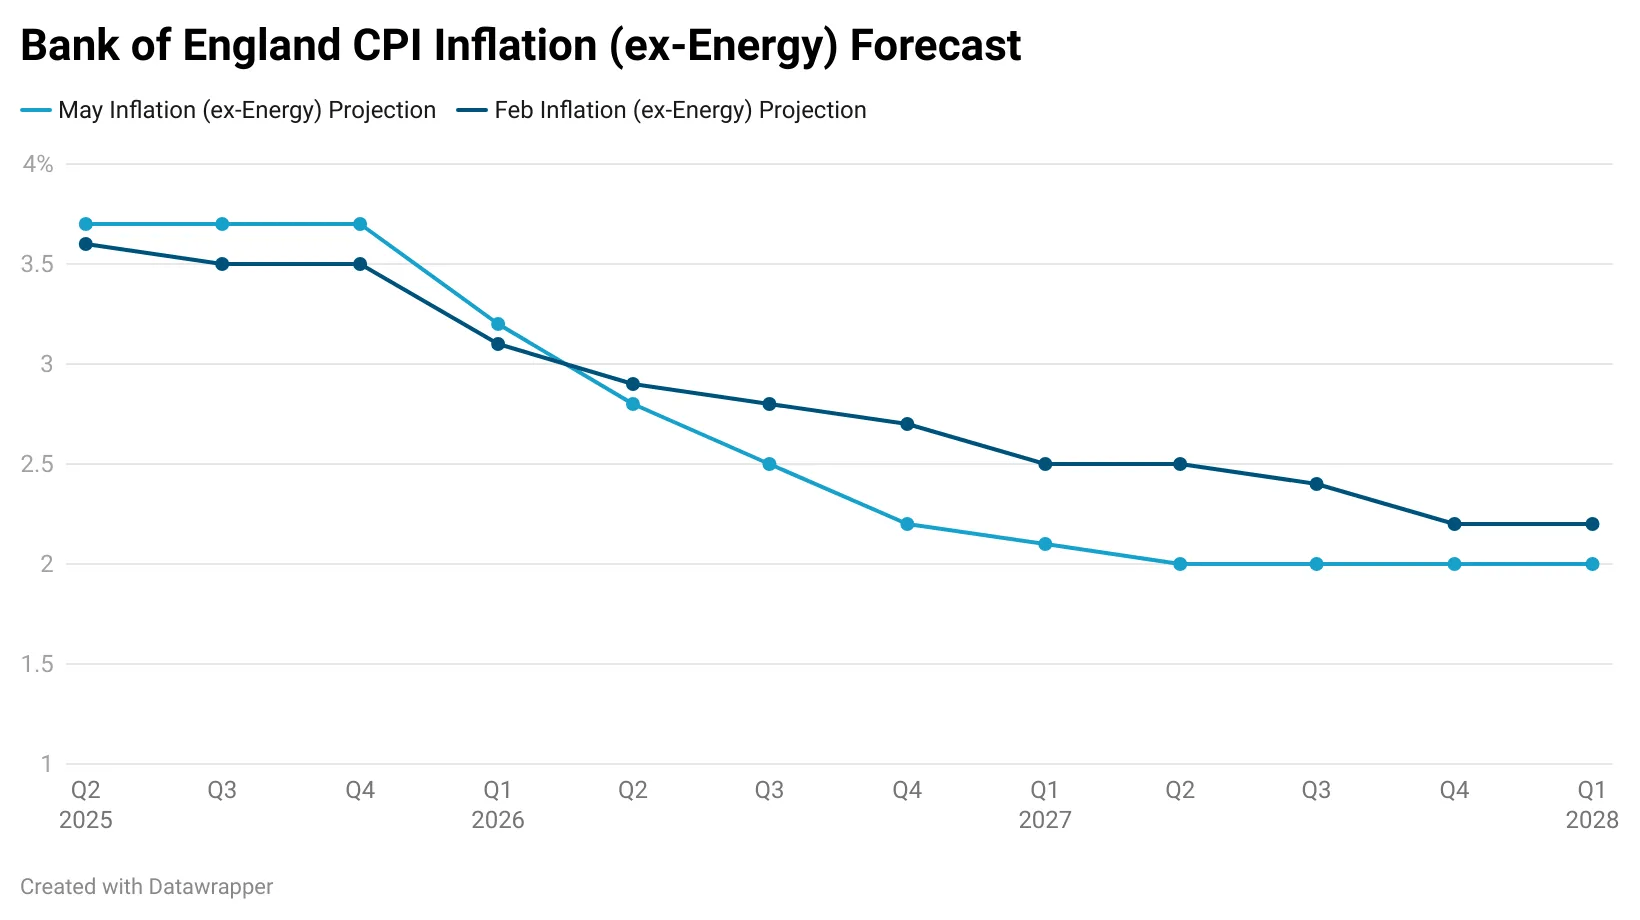
Just a few weeks ago, the Bank of England (”BoE”) opted to cut interest rates as it decided that inflationary pressures had receded just enough to justify an easing in monetary policy. The announcement came with an updated set of forecasts that set forth its expectations on prices pressures over the next four years. In that May Monetary Policy Report, its forecasts for CPI inflation and CPI inflation (ex-energy) in Q2 2025 were 3.4% and 3.7%, respectively, meaning that with the April report, inflation has already surpassed its expectations in the first month of the second quarter. This suggests that the Bank of England should be thinking more about upside risks to the inflation outlook than downside risks that it may perceive from more economic slack.
-
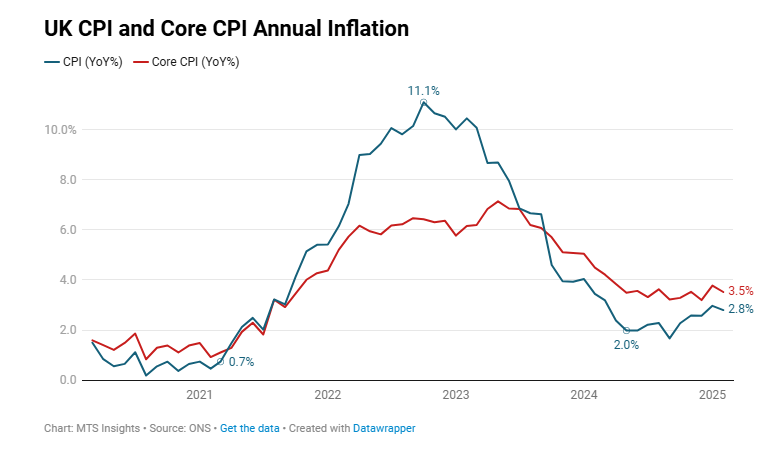
UK CPI increased 0.3% MoM (vs 0.4% MoM expected) and 2.6% YoY (vs 2.7% YoY expected) in March, down from 2.8% YoY in February.
- Core inflation was 0.5% MoM and 3.4% YoY, down from 3.5% YoY previously and in line with forecasts.
- Goods inflation eased from 0.8% YoY to 0.6% YoY while services inflation saw a sharper slowdown from 5.0% YoY to 4.0% YoY.
- Recreation & culture was a major driver of disinflation, as the segment was unchanged on monthly basis (vs 0.9% MoM a year ago). The annual rate slowed -1.0 ppts to 2.4% YoY.
- There was also disinflation evident in communication and restaurant & hotels as their annual rates fell -1.3 ppts to 6.0% YoY and -0.4 ppts to 3.0% YoY respectively.
-
After a hotter-than-expected UK CPI print in January, inflation data in February came in below expectations as it reversed the rise seen in the previous month. The headline CPI index was up 0.4% MoM and 2.8% YoY in February, dropping from 3.0% YoY in January and under consensus projections of a 2.9% YoY increase. This is good news for the Bank of England which was put in a tough spot after inflation had surprised them to start the new year.
CPI
The all items CPI index increased 0.4% MoM and 2.8% YoY in February which meant that both rates were below the consensus forecasts of 0.5% MoM and 2.9% YoY. The headline annual rate was also a -0.2 ppts decline from the January rate of 3.0% YoY which was a surprise increase of 0.5 ppts over the December rate of 2.5% YoY. While there was some disinflation in February, the monthly rate was the highest since October 2024 and, before that, the highest since March 2024. However, it was the smallest MoM increase in a February since 2021.
Energy and food both put upward pressure on the main CPI inflation rates as those segments posted moderate gains on the month:
- Energy was up 0.7% MoM in February, but on an annual basis, was still a deflationary component at -6.8% YoY. The segment tracking liquid & vehicle fuels increased 1.4% MoM alone while electricity & gas costs were mostly unchanged in February. Both are negative on an annual basis. Energy prices are expected to continue to rebound in the first half of the year and are expected to put upward pressure on the headline inflation rate in the next few months.
- The food, alcoholic beverages, and tobacco index increased 0.4% MoM in February, after the strong 1.1% MoM increase in January.. The segments within this index saw increases at or below the headline MoM rate with the exception of alcoholic beverages & tobacco which increased 1.0% MoM. On an annual basis, food, alcohol, and tobacco is up 3.9% YoY, the highest increase since April 2024. Steady gains in food, alcohol, and tobacco prices are also becoming a significant source of inflation pressure, especially alcohol and tobacco prices which are up 5.7% YoY (Duty on non-draught alcohol increased from 1 February 2025 as announced in the Autumn Budget 2024).
Core CPI
The UK’s core CPI inflation rates exclude energy, food, alcohol, and tobacco. In February, Core CPI was up 0.4% MoM and 3.5% YoY, and like the headline rate, was below expectations of 0.5% MoM and 3.6% YoY gains. The February annual rate is a slight deceleration from the 3,7% YoY rate reported in January, which was a notable acceleration from the 3.2% YoY rate in December. Core inflation was pushed up by both goods and services prices which increased 0.4% MoM and 0.5% MoM respectively. Here are some notable details:
- Non-energy industrial goods prices were up 0.3% MoM in February, a slight rebound from the -1.0% MoM decline in the previous month. Most of the gains for the month came from housing goods (+1.0% MoM) and household goods (+1.1% MoM). Other goods indexes were cooler and offset the high monthly rates in those categories: clothing (-0.3% MoM), utilities (-0.2% MoM), and other recreational goods (-0.5% MoM).
- The index for all services was up 0.5% MoM and continues to be the main source of price pressures for consumers. Two services segments posted monthly gains above the headline rate, travel & transport (+1.1% MoM) and recreational & personal services (+0.8% MoM). These were offset by softer gains in housing services (+0.3% MoM), communication (+0.2% MoM), and misc. & other services (+0.2% MoM).
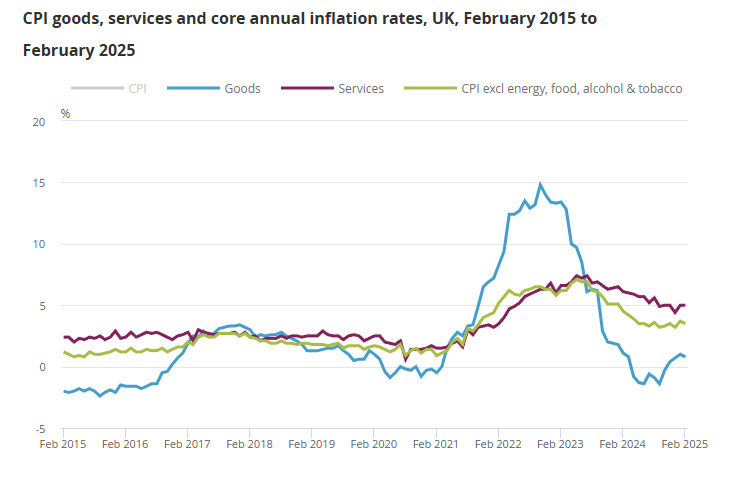
- Looking at annual trends, services inflation is still elevated at 5.0% YoY while goods inflation is at a much lower 0.6% YoY. Even when excluding the deflationary energy segment from goods, prices are only up 1.1% YoY. The heavily weighted recreational & personal services index has come down considerably in the last two years but still sits at an elevated 3.8% YoY (down from 3.9% YoY in January).
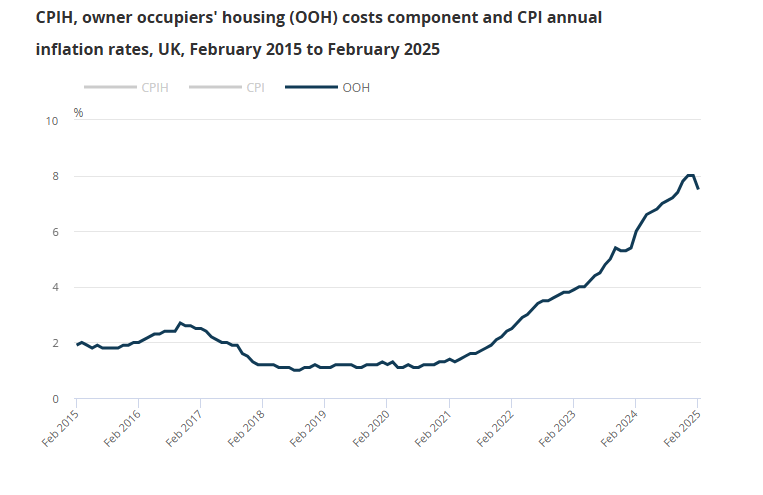
- Inflation in housing costs is still a major issue for consumers. The index tracking rent is up 7.4% YoY and has been above 7% since May 2024. Owner occupier costs rose by 7.5% YoY in February, down from 8.0% YoY in January. The January figure was unchanged from December 2024, and together they were the joint-highest observed since February 1992, when the rate was 8.6% YoY in the constructed historical series.
-
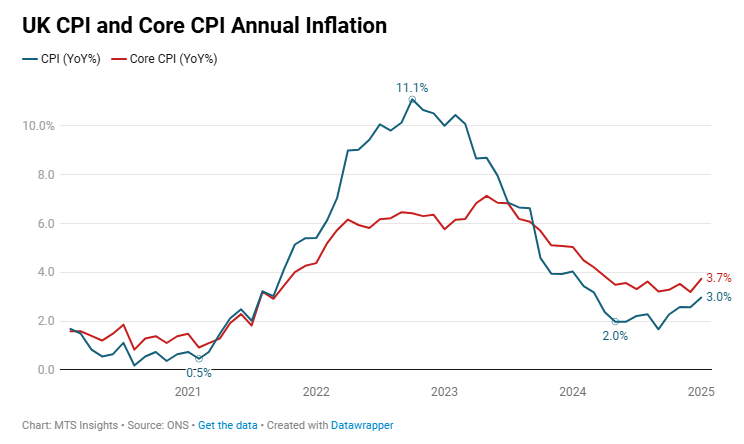
UK CPI inflation was -0.1% MoM (vs -0.3% MoM expected) and 3.0% YoY (vs 2.8% YoY expected) in January, up from 2.5% YoY in December and the highest since March 2024.
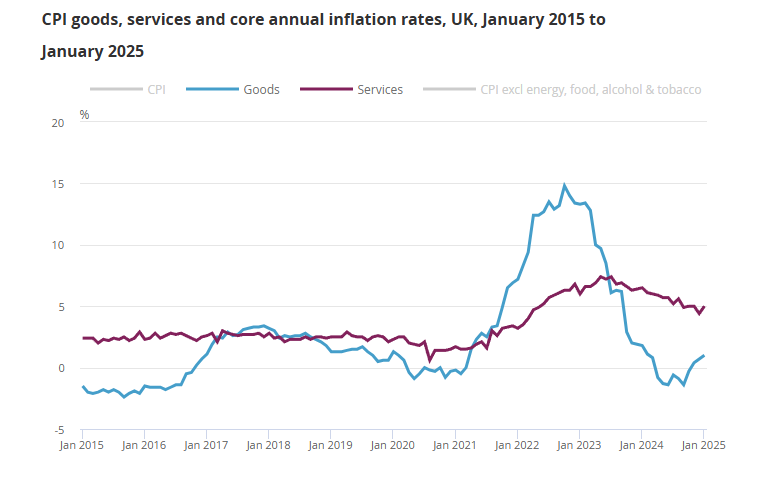
- The CPI goods annual rate rose from 0.7% to 1.0%, while the CPI services annual rate rose from 4.4% to 5.0% (highest since August 2024).
- Core CPI inflation was -0.4% MoM (vs -0.5% MoM) and 3.7% YoY (vs 3.7% YoY), the highest since April 2024.
- The rise in the annual rates was a result of weak monthly readings in January 2023: CPI monthly inflation at -0.6% MoM and core CPI inflation at -0.9% MoM.
- The segments with the largest increases were alcohol and tobacco (+1.8% MoM), education (+2.4% MoM), food and beverages (+0.9% MoM), and housing and household services (+0.8% MoM).
- These were offset by strong declines in clothing (-3.3% MoM), furniture (-1.3% MoM), and restaurants and hotels (-1.0% MoM).
-
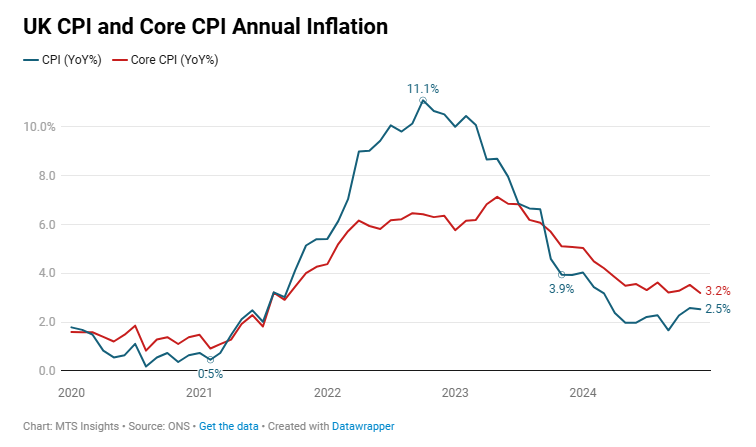
UK CPI inflation was 0.3% MoM (vs 0.4% MoM expected) and 2.5% YoY (vs 2.6% YoY expected) in December, down from 2.6% YoY in November. Core inflation was also cooler than expected at 0.3% MoM (vs 0.5% MoM) and 3.2% YoY (vs 3.4% YoY) which is the lowest annual rate since September 2021.
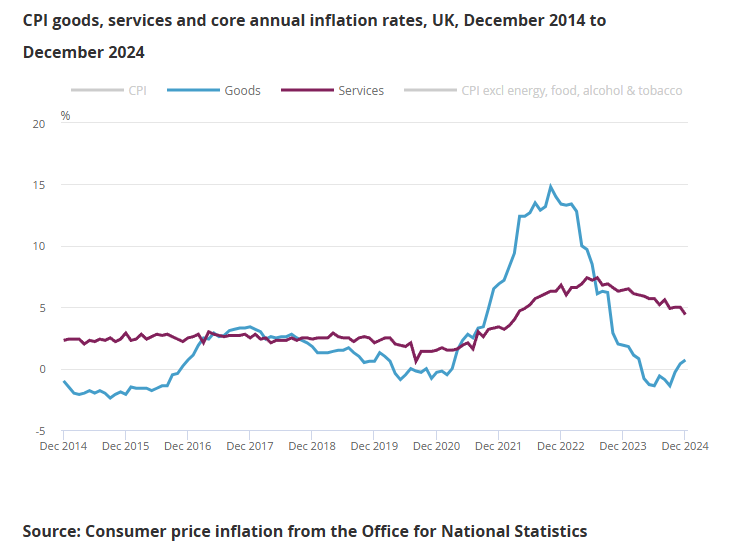
The CPI goods annual rate rose from 0.4% YoY to 0.7% YoY, while the CPI services annual rate saw a substantial cooling as it fell from 5.0% YoY to 4.4% YoY, the lowest rate since March 2022.
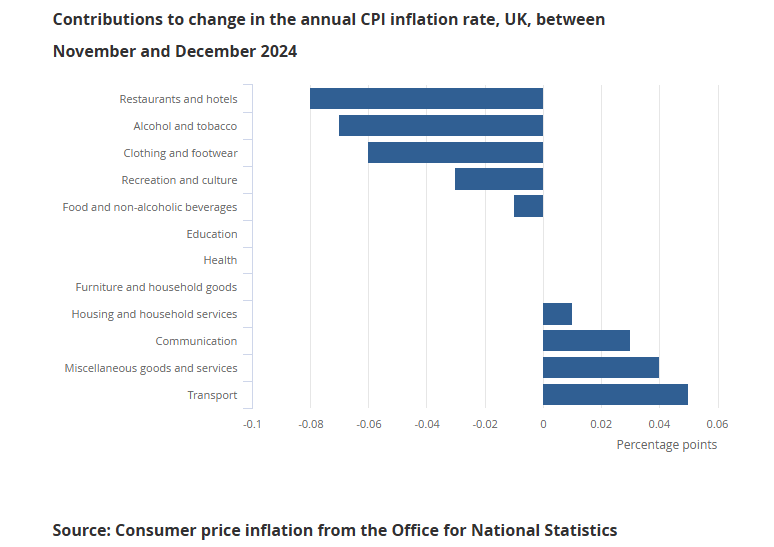
Restaurants & hotels (-0.08 ppts) and recreation & culture (-0.03 ppts) were two key services segments of inflation that contributed to the deceleration in the annual CPI rate.
-
UK CPI increased 0.1% MoM and 2.6% YoY in November, in-line with expectations.
- Core CPI inflation was slightly softer than expectations of a 3.6% YoY rate at 3.5% YoY.
- Goods CPI flipped from -0.3% YoY in the previous month to 0.4% YoY. Services CPI remained up 5.0% YoY.
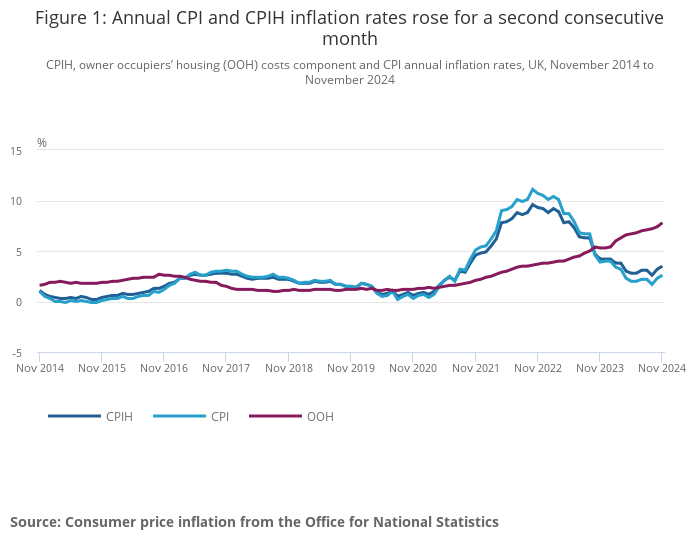
- The owner occupiers' housing costs (OOH) component of CPIH rose by 7.8% YoY, up from 7.4% YoY October. This is the highest annual rate since February 1992 in the constructed historical series.
- The largest monthly increases came from alcohol and tobacco, up 1.4% MoM, and clothing & footwear, up 0.6% MoM.