
 JOLTS Survey
- Source
- BLS
- Source Link
- https://www.bls.gov/
- Frequency
- Monthly
- Next Release(s)
- March 31st, 2026 10:00 AM
-
May 5th, 2026 10:00 AM
-
June 2nd, 2026 10:00 AM
-
June 30th, 2026 10:00 AM
-
August 4th, 2026 10:00 AM
-
September 1st, 2026 10:00 AM
-
September 29th, 2026 10:00 AM
-
November 3rd, 2026 10:00 AM
-
December 1st, 2026 10:00 AM
Latest Updates
-
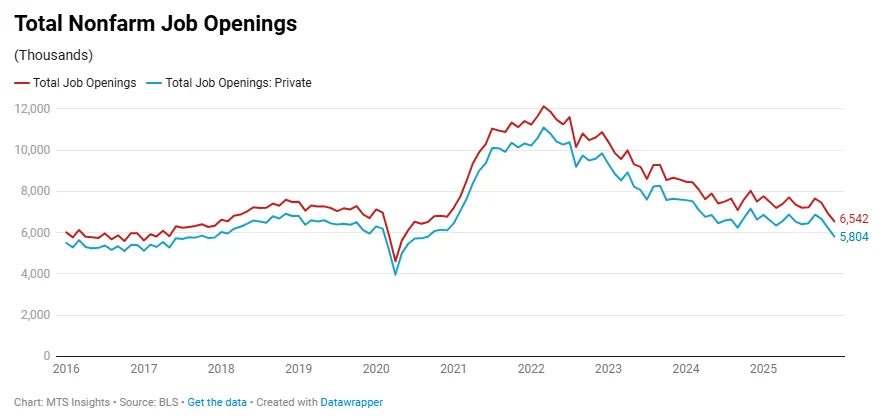
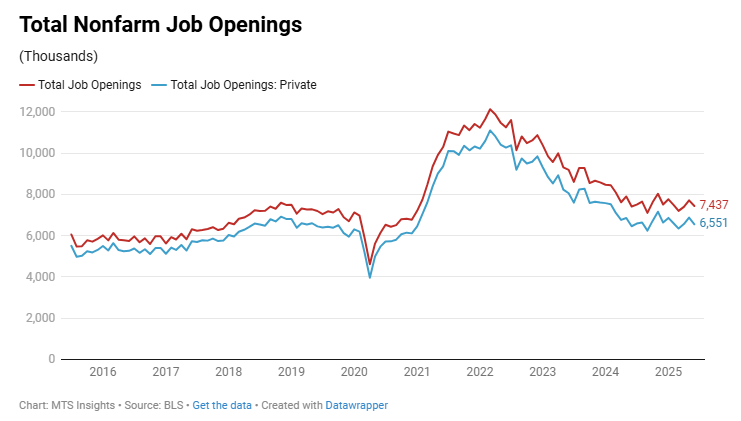
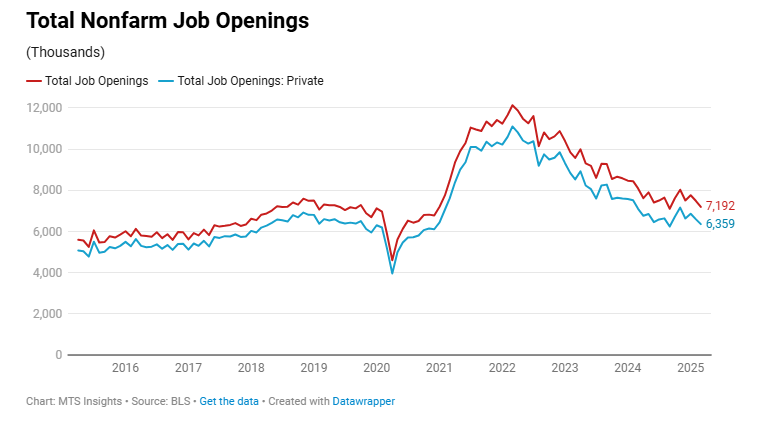
Total US job openings fell -386k to 6.54 million in December, with private openings seeing a larger decline of -423k to 5.80 million. This is the lowest level of job openings since 2021.
- In terms of the job openings rates, the overall and private openings rates both fell -0.3 ppts MoM and -0.6 ppts YoY to 3.9% and 4.1%, respectively.
- Total hires increased by 172k to 5.29 million, while total separations increased 107k to 5.25 million.
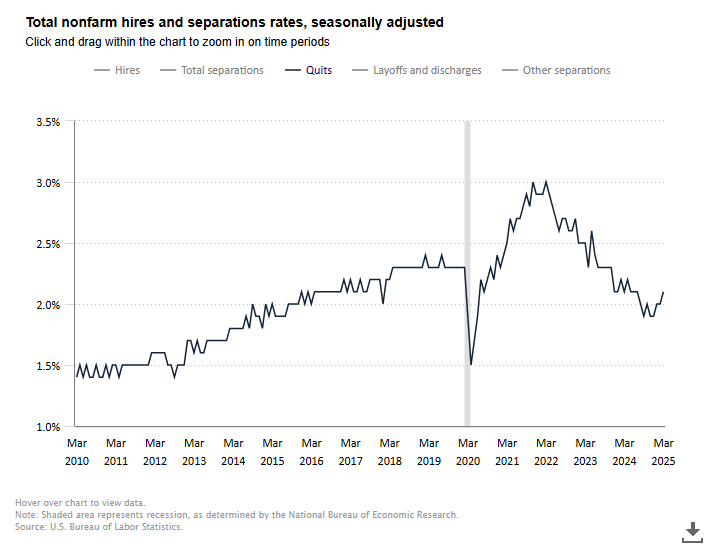
- Total quits edged up by 11k to 3.2 million, back to levels last seen in Q2 2025. The quits rate is actually up 0.1 ppt YoY.
- Total layoffs and discharges increased by 61k to 1.76 million, with private layoffs and discharges increased by 70k to 1.969 million.
- The number of job openings for November was revised down by 218k to 6.9 million, the number of hires was revised up by 6k to 5.1 million, and the number of total separations was revised up by 64k to 5.1 million.
-
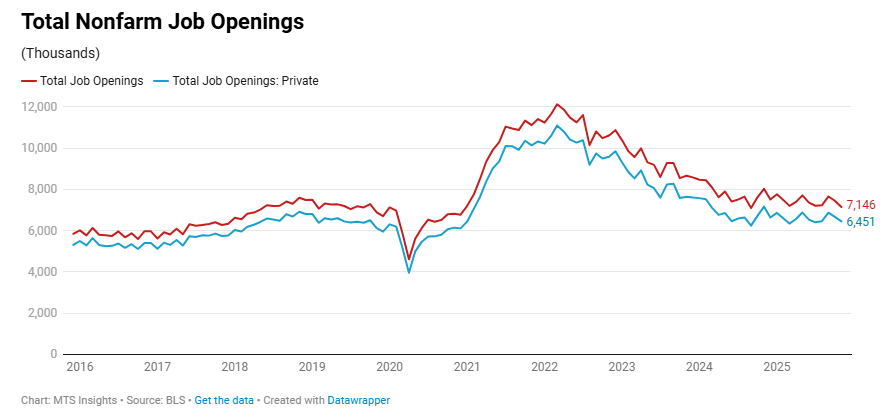
Job openings fell -303k to 7.15 million (vs 7.60 million expected) in November, now down -81k from August (across the shutdown data points).
- Private job openings were down -214k to 6.45 million, and the private job openings rate fell -0.2 ppts to 4.5%, equal to the August rate.
- Total hires fell -253k to 5.11 million (down around -11k since August), while total separations increased 11k to 5.08 million (down around -31k since August).
- Total quits increased 188k to 3.16 million (up 70k since August), pushing the quits rate up 0.1 ppt to 2.0%.
- Total layoffs and discharges spiked to 1.85 million in October but are now down -163k to 1.69 million in November. The level is now lower than a year ago by -52k.
-
The JOLTS report at 10 am provided an update on two months' worth of data, September and October; however, the BLS noted that the September statistics are based on “partial data” due to disruptions caused by the government shutdown. Therefore, in this case, it’s worth more to look at changes over the last two months. Here are the key highlights from the October JOLTS report:
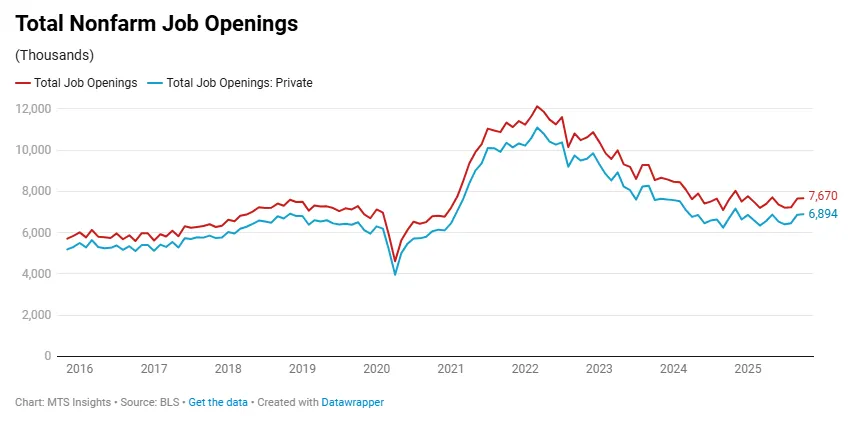
- The headline US job openings number increased to 7.67 million in October, up 443k from the August total of 7.23 million. The job openings rate jumped from 4.3% in August to 4.6% in October.
- Total private job openings increased from 6.46 million in August to 6.89 million in October, with the private job openings rate up 0.3 ppts to 4.8% over the last 2 months.
- Total hires increased just 23,000 from August to October, and total separations fell by -61,000. Within separations, total quits were down -141,000 while total layoffs and discharges increased by 129,000.
- Total private layoffs & discharges increased by 111,000 from August to October. Businesses with 10 to 49 employees and with 50 to 249 employees saw the largest increases in the private layoffs & discharges rates, up 0.2 ppts to 1.3% and up 0.3 ppts to 1.4%, respectively.
The JOLTS data looked to be a bit mixed in the October report, with a large increase in job openings being countered with a decline in quits and an increase in layoffs and discharges. Taken together, the details suggest a labor market that is no longer as overheated as it was in 2022 and early 2023, but that still retains pockets of resilience, particularly on the demand side. The continued rise in openings points to firms maintaining a need for additional workers (that they aren’t finding due to lower labor supply), yet the slowdown in quits and the uptick in layoffs indicate that workers are feeling less secure in their employment. This combination supports the narrative of a labor market that is lacking dynamism rather than weakening sharply, with hiring conditions normalizing but not collapsing as the year draws to a close.
-
JOLTS: September 2025 (CANCELLED)
-
US job openings increased just 19k to 7.23 million in August, roughly in line with expectations of 7.2 million, and the job openings rate was unchanged at 4.3%.
- Private job openings increased 56k to 6.46 million while government job openings dropped -37k to 770k.
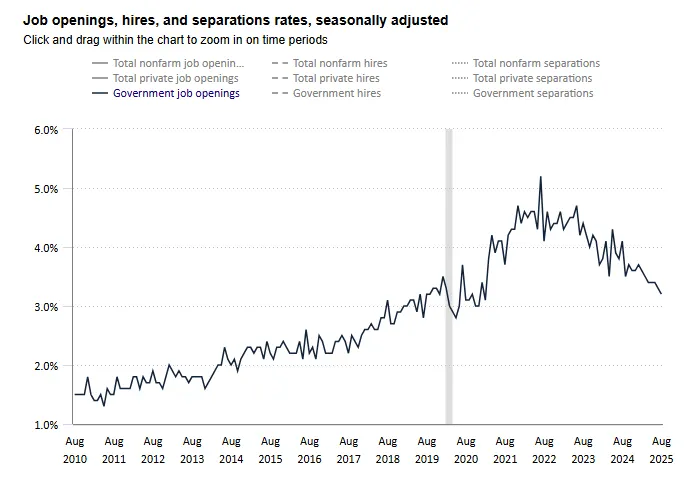
- The government job openings rate dropped -0.1 ppt to 3.2% and is down -0.9 ppts from a year ago to the lowest since February 2021.
- Total hires fell -114k to 5.13 million (rate down -0.1 ppt to 3.2%), and total separations fell -110k to 5.11 million (rate down -0.1 ppt to 3.2%).
- Total quits dropped -75k to 3.09 million, and the quits rate fell -0.1 ppt to 1.9%.
- Total layoffs and discharges were down -62k to 1.73 million, and the layoffs and discharges rates was unchanged at 1.1%.
-
Job Openings
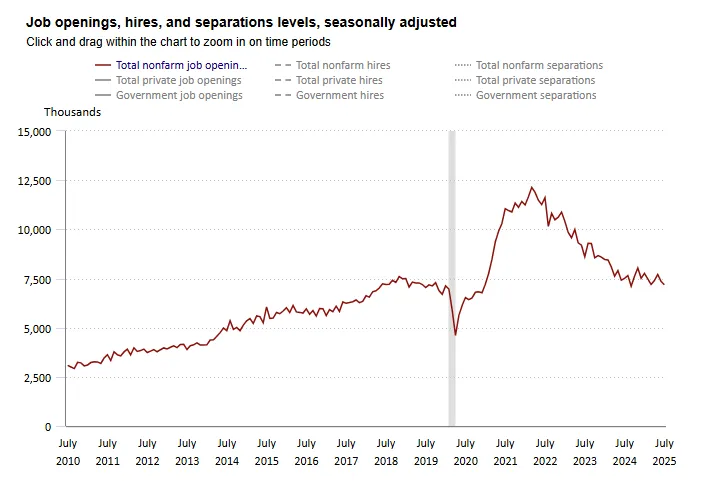
The data released this morning in the BLS’s JOLTS survey pointed to a continuation of the gradual decline in hiring demand in the labor market. In July, the total number of job openings fell -176k to 7.18 million, well below the expectations of a slight increase to 7.40 million. The job openings rate also declined, dropping from 4.4% in June to 4.3% in July. This decline in openings at the beginning of Q2 brings the overall level down to its lowest point since September 2024 and the 2nd lowest since December 2020. In these headline data points, we see clear evidence of weaker labor demand.
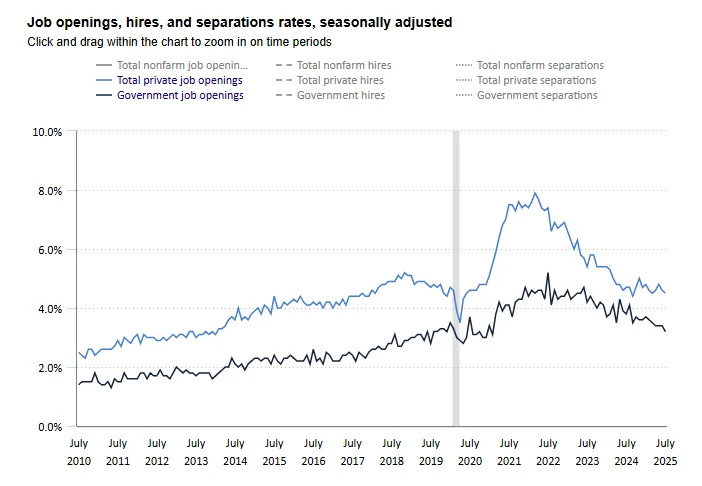
The data for private sector openings saw a similar trend. Total private openings were down -138k to 6.40 million, and the openings rate was down -0.1 ppts to 4.5%. These data points were consistent with lows seen in March of this year and September 2025. The largest declines in the industry details for job openings rates were in retail trade (-0.7 ppts to 3.2%) and health care & social assistance (-0.7 ppts to 5.1%), and the smaller arts & recreation industry saw a sharp -2.1 ppts decline to a rate of just 3.8%. Government job openings also declined, down -38k to 783k, with the rate falling to just 3.2% in July, down from 3.7% in January 2025 and the lowest since February 2021.
Hires and Separations
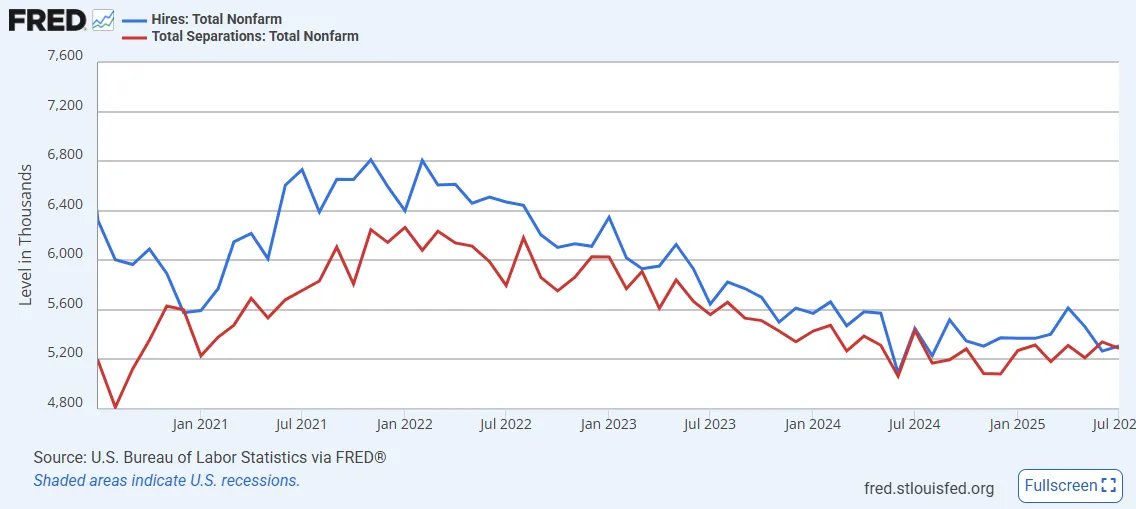
A feature of the recent cooling in the labor market is that both hires and separations have slowed together. This has created what Fed Chair Powell in his Jackson Hole speech called “a curious kind of balance” in the labor market where there is a “slowing in both the supply of and demand for workers.” Indeed, in July, both hires and separations saw little movement with the former up 41k and the latter down -52k. The rates for both hires and separations remained unchanged at 3.3%, and the levels of both are down around -140k from a year ago. The private sector data is very similar with both private hires and separations down around -80k to -90k over the last year.
Within separations, there wasn’t a significant change in the number of quits or layoffs. Total quits fell just -1k to 3.21 million, and the quits rate remained unchanged at 2.0% for the fourth straight month. The most significant move in quits is in the private sector over the last year where the quits rate has fallen slowly from 2.4% in July 2024 to 2.2% in July 2025. The total number of layoffs & discharges increased just 12k to 1.81 million, with private layoffs & discharges up just 14k. Over the last year, the increase in the private layoffs & discharges rate has only increased 0.1 ppts to 1.3%.
Overall, the data describes a labor market where firms are reluctant to expand hiring but at the same time aren’t increasingly laying off employees. The trend of stagnation in private sector hiring paired with the Trump administration’s efforts to shrink the government through hiring freezes, contract cancellations, and workforce reductions has caused the softening in the labor market to be a little harsher than if the public sector were more expansionary.
Revisions
Revisions to the July jobs report were the focus when that data was released early last month. Are there any revisions worth looking at in the July JOLTS report? Here’s what the BLS reported:
- The job openings total for June was revised down by -80k. The June revision is an adjustment of -1.1% which is just under one standard deviation away from the average revision of 0.4%. Notably, private sector job openings in June were only revised down by -15k.
- The total for hires in June was revised up by 63k, an adjustment of +1.2%. This is slightly above the average revision of +0.6%. Private hires in June were revised up 72k.
- The total for separations in June saw a sharp upward revision of 281k. This adjustment of +5.6% is more than two standard deviations above the mean revision of +0.7%. Private separations saw a similar, unusual upward revision.
- The upward revision in separations came from record upward revisions to layoffs & discharges in June. Specifically, total layoffs & discharges were revised up 192k (or +12.0%), and private layoffs & discharges were revised up 174 (or 11.3%). These adjustments were both record highs based on data going back to 2016.
- Looking specifically at government data, revisions to June data suggested much weaker hiring trends at the end of Q2 2025. Job openings were revised down -65k (or -7.3%), hires were revised down -11k (or -3.2%), and layoffs/discharges were revised up 18k (or +29.5%).
Overall, taken together with the July data, the revisions reframe the June data as weaker, but not nearly to the degree of the revisions to the July employment data. The record revisions to the layoffs & discharges numbers are particularly significant and will likely be a factor in the Fed’s deliberations later this month.
-
Job openings in the U.S. declined by -275k to 7.44 million (vs 7.55 million expected) in June 2025, with the openings rate slipping -0.2 ppts to 4.4%.
- Private sector job openings fell -325k to 6.55 million (rate down -0.2 ppts to 4.6%).
- Hires decreased -261k to 5.20 million, pushing the hire rate down -0.1 ppts to 3.3%.
- Total separations declined -153k to 5.06 million (rate down -0.1 ppts to 3.2%), including a -128k drop in quits (rate steady at 2.0%).
- Layoffs and discharges held steady at 1.60 million with a flat 1.0% rate; private layoffs rose modestly to 1.54 million but the rate was unchanged at 1.1%.
- The labor market continued its gradual cooling trend, with openings and hiring both easing while quits remain subdued.
-
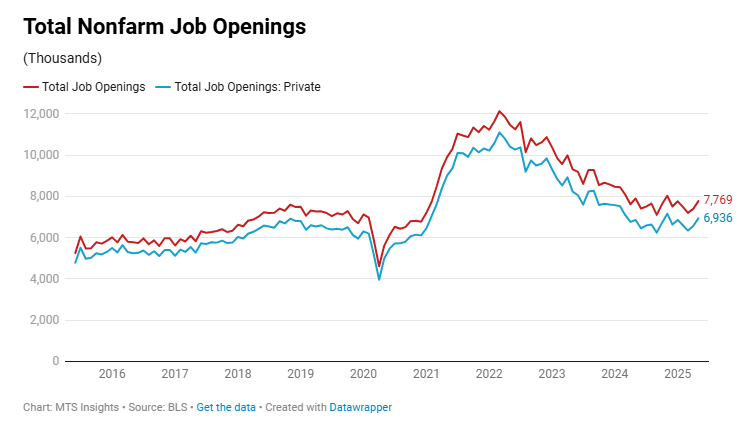
The total number of job openings increased 374k to 7.78 million in May, well above the expectation of openings falling to 7.3 million. The job openings rate increased 0.2 ppts to 4.6%.
- Total private job openings increased 374k to 6.94 million, with the rate up 0.3 ppts to 4.9%, and total government job openings was up just 1k to 834k, with the rate unchanged at 3.4%.
- Total hires fell -112k to 5.50 million, and the hire rate dropped -0.1 ppt to 3.4%.
- Total separations fell -71k to 5.24 million, and the separations rate was unchanged. Private separations fell -89k, and government separations increased 17k.
- Total quits increased 78k to 3.29 million, and the quits rate increased 0.1 ppts to 2.1%.
- Total layoffs and discharges dropped -188k to 1.60 million, and the layoff/discharge rate dropped -0.1 ppts to 1.0%. The private layoff/discharge rate dropped -0.2 ppts to 1.1%.
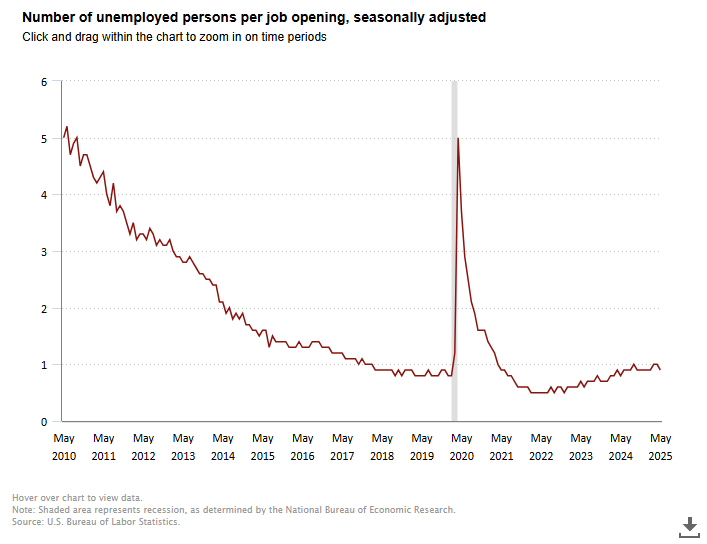
- While job openings did tick higher in May, the ratio of unemployed persons per opening fell to 0.9x in May, down from 1.0x in April.
-
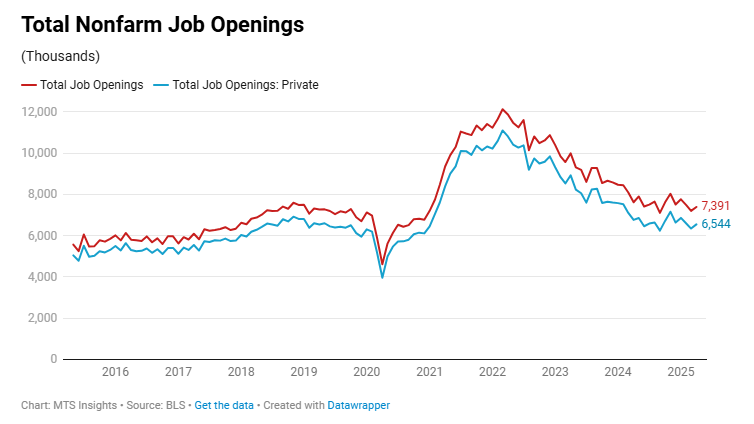
US job openings rose 191k to 7.39 million in April, ahead of expectations of a slight decline to 7.10 million, with the job openings rate ticking up 0.1 ppts to 4.4%.
- Total private job openings increased 202k to 6.54 million, while total government job openings fell -11k to 847k.
- Hires increased 169k to 5.57 million, and the hire rate also edged up 0.1 ppts to 3.5%.
- Total separations rose 105k to 5.29 million, but the separation rate was unchanged at 3.3%.
- Quits declined -150k to 3.19 million, with the quit rate falling -0.1 ppts to 2.0%.
- Layoffs and discharges jumped 196k to 1.79 million, with the layoff rate up 0.1 ppts to 1.1%, marking the highest level since January.
- Over the last year, the private quits rate fell -0.2 ppts to 2.2%, and the private layoff/discharge rate increased 0.1 ppts to 1.3%.
-
US jobless claims fell -288k to 7.19 million in March, well below the 7.48 million forecast.
- Private job openings fell -229k to 6.36 million, and the private job openings rate fell -0.1 ppts to 4.5%, the lowest since September 2024.
- Total hires increased 41k to 5.41 million, and total separations fells -179k to 5.14 million.
- Total quits increased 82k to 3.33 million, and the quit rate increased 0.1 ppts to 2.1%, the highest since July 2024.’
- Total layoffs fell -222k to 1.56 million, and total private layoffs fell -229k to 1.45 million, both lower than a year ago.
-
The February JOLTS report highlighted the short-term volatility in labor market data and how difficult it is to distill short-term trends from month-to-month changes. However, it did not hide the general trend of a gradual cooling in the labor market which, for now, remains on solid footing despite Trump’s DOGE cutting federal programming.
Job Openings

After a surprise bounce in openings in January, openings in February returned back towards levels seen at the end of 2024. Total US job openings fell -194k to 7.57 million in February, below expectations of a smaller drop to 7.63 million openings. The opening rate fell -0.2 ppts to 4.5%, identical to the reading in December 2024. Basically all of the decline in openings were in the private sector. Private openings fell -193k, and the openings rate was down -0.1 ppts to 4.7%. The government openings rate was unchanged at 3.7%, and interestingly, the federal government openings rate increased 0.2 ppts to 4.4% despite February being the first full month of Trump’s DOGE rummaging through federal programs.
There were some notable divergences across industries.
- The largest decline was in trade, transportation, and utilities where openings fell -163k (and the rate was down -0.6 ppts to 3.5%). However, the decline basically just reverted the job openings level back to December 2024 levels, suggesting this move could have been a month-to-month peculiarity. Within this industry, retail trade (-126k) and wholesale trade (-56k) fell the most, but again, both settled near December 2024 levels.
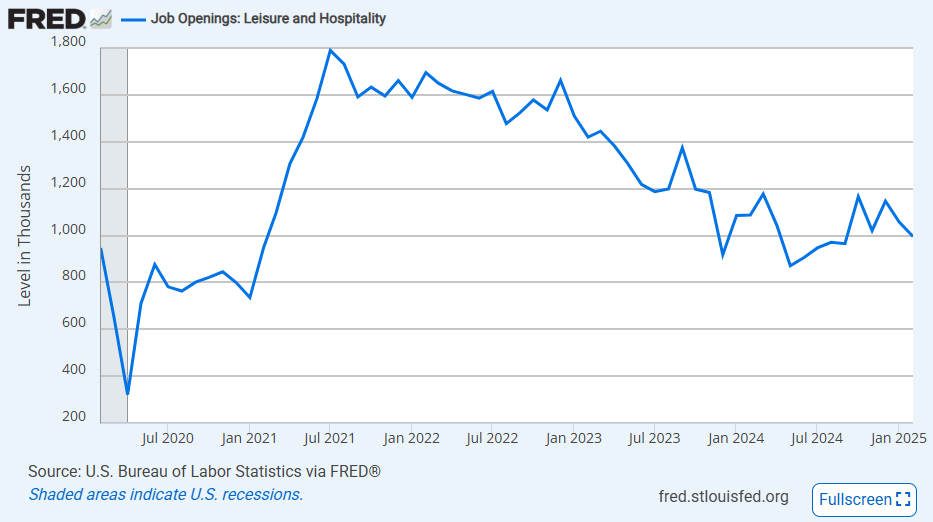
- The next largest declines were in two key services industries. Financial activities job openings fell -80k and the rate fell -0.8 ppts to 4.5%. The decline wasn’t a complete reversal of the January gain and financial openings are 30k above the December 2024 level. Leisure and hospitality openings was the next largest decliner, down -61k. Unlike trade and financial, this industry saw a decline in openings in January. Openings are down -101k from the December 2024 level, and the openings rate is down -0.8 ppts to 5.5%. It is also worth noting that leisure and hospitality openings are now at the lowest since September 2024, when the Fed made its most bearish assessment of the US labor market.
- The professional and business services industry saw the largest increase in openings in February, up 134k, and coincidentally, it saw one of the largest declines in January. The job openings rate for the industry bounced back 0.5 ppts to 5.6% and is just one tick below the 5.7% rate in December 2024.
Hires & Separations
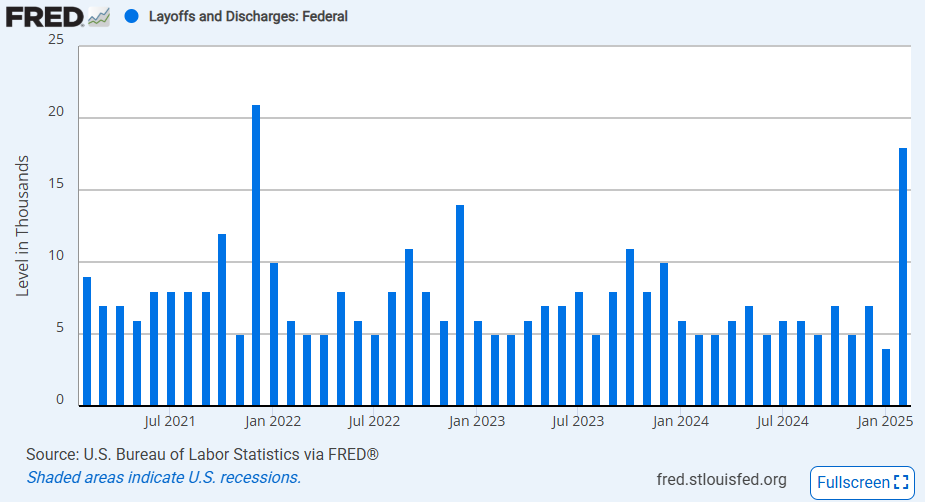
The data on hires and separations in February reflected the recent trend of inelasticity in the US labor market. Hires were up just 25k in the month with private hiring growth of 46k being offset by a decline of -21k in government hiring. While hiring growth was subdued, separations actually declined, down -11k as private separations fell -44k and government separations increased 33k. These two data points reflect some the impact of DOGE’s hiring freeze and initial workforce cutting. In both cases, the cooling in the government labor market countered the trend in a stronger private sector labor market. Notably, federal government layoffs & discharges increased 18k in February, the largest since December 2021. This is likely to continue in March and Q2 2025.
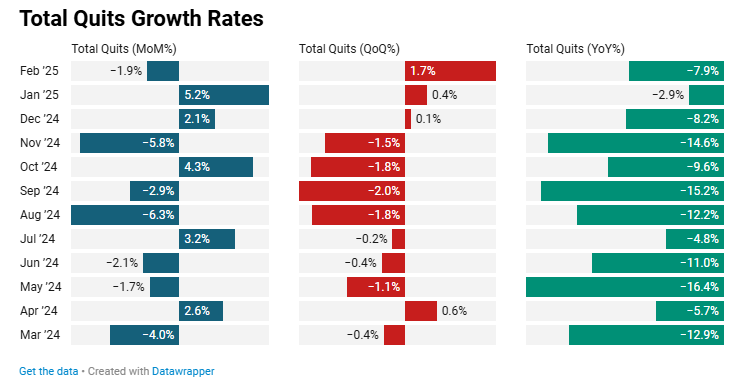
Within the separations data, there was a decline in quits in February, totaling -61k or -1.9% MoM, which was a slight reversal of the large increase in quits in January and December. This included an -80k drop in private quits and an increase in government quits of 19k. The private quits rate fell -0.1 ppts to 2.2%, but this was still above the November and December readings. Within industries, the data was noisy, but generally, the services industries reported a majority of the quits. The smaller decline in quits in February means that in the last quarter, quits have increased 1.7% QoQ after being down more significantly in Q4 2024.
Indicator YoY YoY% Private Job Openings -854,000 -11.4% Private Hires -231,000 -4.4% Private Separations -231,000 -4.5% Private Quits -278,000 -8.5% Private Layoffs & Discharges 98,000 +6.1% With Q1 2025 data being full of noise and government data affected by DOGE, it is important to look at a longer-term trend for a better perspective. In general, we have seen a substantial decline in private job openings over the last year representing a gradual decline in labor demand. However, while we have seen hires decline, we have also seen separations drop to the same degree. This suggests the labor market is still broadly in balance and there is not a major wave of layoffs occurring. Notably, total private quits have fallen by -8.5% which means that workers are increasingly uncertain about the job market, and they have less confidence in finding a new job upon quitting. Indeed, layoffs & discharges have increased noticeably over the last year, but not to a troubling degree.
Market Reaction
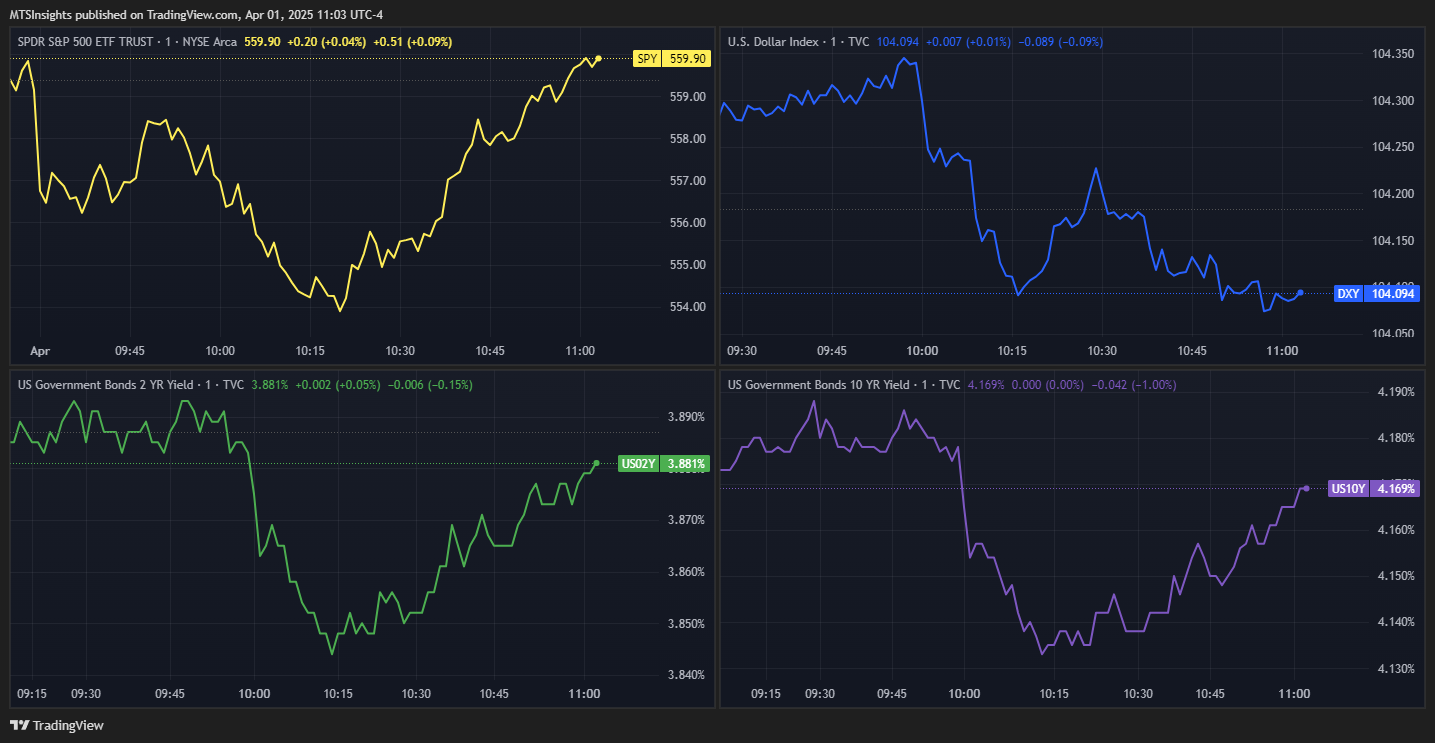
The February JOLTS data was seen as dovish by the market in trading immediately after the release at 10 am. The 2-year and 10-year Treasury rates both fell in the 15 minutes following the release, but both have more-or-less recovered from that decline. The same can be said for trading in SPY and the USD in that period. I wouldn’t really have expected this report to have a major impact on trading since tariff headlines and other macro reports will be weighing on investors as well.
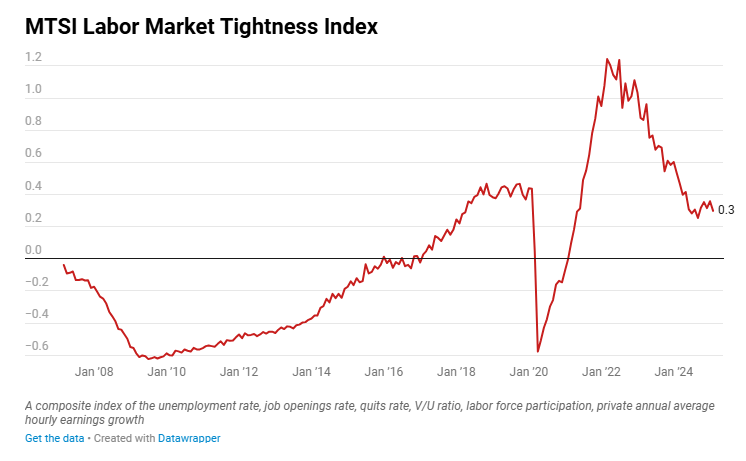
In the end, there is even less of a reason to react to today’s JOLTS data because it appears to be just a reversal of the January movements. My index tracking labor market tightness suggests that there hasn’t been a major change in job market conditions since the start of Q4 2024, and we are just seeing some of the short-term tightening trends unwind. Importantly, we are still above the index’s three-year low set in September 2024, the month when the Fed cut by 50 bps in response to the Fed’s assessment that the labor market was weakening and unemployment would rise through the end of 2024.
With that being said, February JOLTS data is mostly neutral for the Fed’s assessment of the labor market as it collects data for its May decision. The March JOLTS data will be more interesting as we will see the initial impact of tariffs on labor demand and the continued impact of DOGE which ramped up workforce cutting last month.