
 J.D. Power Automotive Forecast
- Source
- J.D. Power
- Source Link
- https://www.jdpower.com/
- Frequency
- Monthly
- Next Release(s)
- May 22nd, 2026 10:00 AM
Latest Updates
-
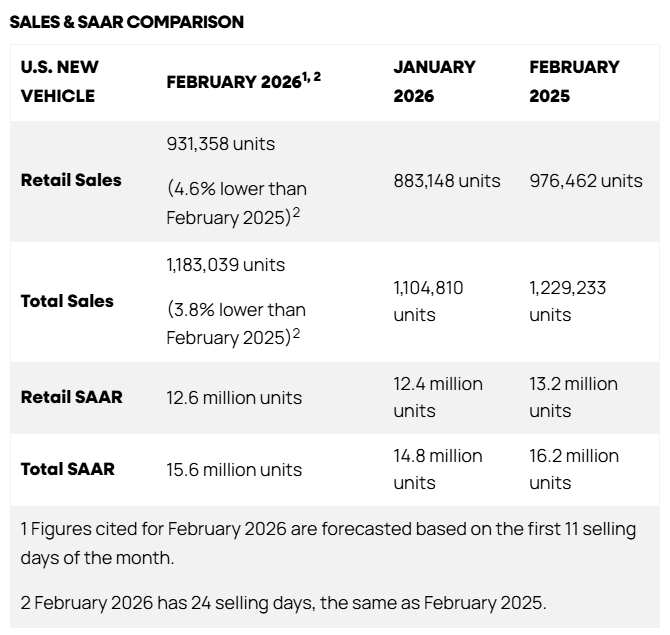
U.S. total new-vehicle sales are forecast at 1.183M units in February (-3.8% YoY) with retail sales -4.6% YoY, indicating weaker annual demand despite seasonal improvement.
-
Total sales SAAR is 15.6M (vs 16.2M in February 2025) and retail sales SAAR is 12.6M (vs 13.2M), showing softer annualized sales momentum.
-
EV share is 6.6% (-1.8 ppts YoY) while ICE rises to 78.7% (+2.6 ppts) and HEV 13.5% (+0.1 ppt), reflecting a shift away from EVs.
-
Average retail transaction price is $46,303 (+2.7% YoY); non-EV prices $46,097 (+3.0%) and EV prices $46,528 (+2.6%), indicating continued price pressures.
-
Average monthly payment is $811 (+$32 YoY) while loan rates fell to 6.72% (-31 bps YoY) and 84-month loans rose to 12.7% (+1.8 ppts), suggesting affordability strain despite easing rates.
-
Incentive spending averages $3,293 (+$63 YoY); EV discounts $10,356 (-$1,664 YoY) and non-EV discounts $3,085 (+$346 YoY), showing incentives shifting toward non-EV vehicles.
-
Inventory stands at 2.19M units (+1.4% YoY) with 65 days supply and retailer profit per unit $2,524 (+$83 YoY), while total consumer spending is $41.3B (-2.4% YoY), indicating higher per-unit profitability but lower aggregate sales value.
-
Used vehicle prices average $29,488 (+$448 YoY) and trade-in equity is $7,013 (roughly flat YoY), suggesting continued strength in the used market supporting trade-ins.
-
Share of buyers with negative equity is 31.5% (+3.4 ppts YoY), indicating more households carrying loan balances into new purchases.
-
Fleet sales total 251,681 units (-0.4% YoY) and represent 21.3% of sales (+0.7 ppts), showing a slightly larger fleet share within overall volumes.
-
-
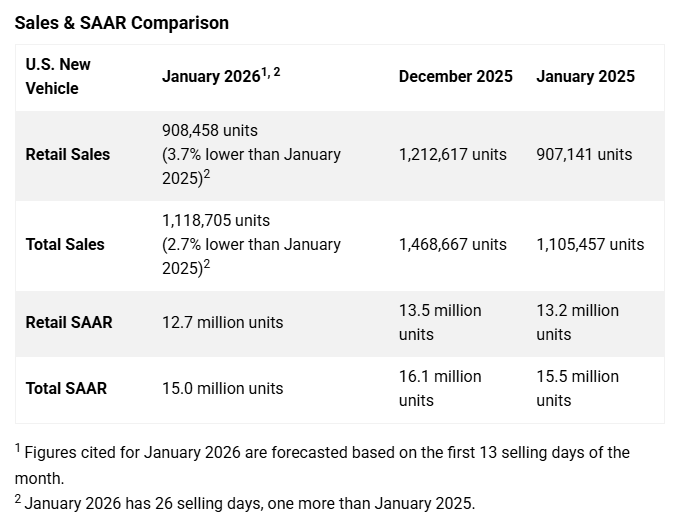
U.S. new-vehicle sales are forecast at 1.12M units in January 2026 (-2.7% YoY), reflecting a modestly softer start to the year.
-
Total new-vehicle sales (retail + non-retail) are projected at 1,118,700 units (-2.7% YoY), though on an unadjusted selling-day basis sales are +1.2% vs January 2025 due to one extra selling day (26 vs 25).
-
Total SAAR is expected at 15.0M units, down from 15.5M in January 2025 and down from 16.1M in December 2025, indicating weaker annualized momentum entering 2026.
-
Retail new-vehicle sales are projected at 908,500 units (-3.7% YoY), with retail SAAR at 12.7M (vs 13.2M in January 2025 and 13.5M in December 2025).
-
EVs are expected to account for 6.6% of retail sales (-2.9 ppts YoY), while ICE vehicles rise to 77.7% (+2.7 ppts YoY) and HEVs increase to 14.7% (+1.4 ppts YoY), showing a mix shift toward ICE/hybrids.
-
Average retail transaction prices are expected at $45,880 (+1.1% YoY), with non-EV prices at $45,510 (+0.9% YoY) and EV prices at $51,981 (+18.1% YoY), highlighting a sharp relative increase for EV pricing.
-
Average monthly finance payments are projected at $760 (+$24 YoY), while the average new-vehicle loan rate is 6.29% (-48 bps YoY); 84-month loans are expected to rise to 11.7% of financed sales (vs 9.9% a year ago), underscoring affordability strain.
-
Incentive spending averages $3,192 per vehicle (+$25 YoY), with EV discounts at $11,212 (-$1,820 YoY) versus non-EV discounts at $3,004 (+$403 YoY), reflecting lower EV discounting alongside stronger incentives on ICE vehicles.
-
Retail inventory is estimated at 2.12M units (-1.4% YoY), equal to 59 days of supply (+2 days YoY), while dealer profit per unit is projected at $2,148 (-$62 YoY; +$224 vs December) and total retailer profit at $1.9B (-2.6% YoY).
-
-
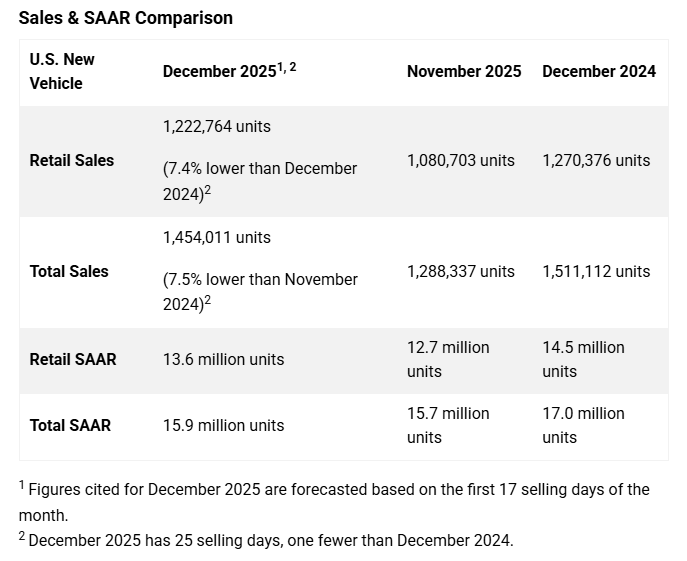
U.S. new-vehicle sales are forecast at 1.45M units in December 2025 (-7.5% YoY), reflecting a year-end slowdown after a volatile sales pattern.
-
Total new-vehicle sales, including retail and non-retail, are projected at 1,454,000 units (-7.5% YoY), or -3.8% YoY on an unadjusted selling-day basis, pointing to softer year-end volumes despite an extra selling day versus last year.
-
Total SAAR is expected at 15.9M units, down 1.1M from December 2024, while retail SAAR rises to 13.6M from 12.7M in November, indicating some sequential improvement but weaker YoY momentum.
-
Retail sales are forecast at 1,222,800 units (-7.4% YoY), with Q4 retail volumes down -4.8% YoY, contrasting with full-year 2025 retail sales projected up +4.0% YoY on a selling-day-adjusted basis.
-
EVs are expected to account for 6.6% of retail sales, down 4.6 ppts YoY, while ICE vehicles rise to 78.1% (+4.6 ppts YoY), showing a pronounced shift away from EV purchases late in the year.
-
Average new-vehicle transaction prices are projected at $47,104 (+1.5% YoY), while average monthly finance payments rise to $776 (+$21 YoY), underscoring continued affordability pressures.
-
Incentive spending averages $3,433 per vehicle (+$77 YoY), with EV discounts at $11,414 (-$57 YoY) and non-EV incentives at $3,219 (+$425 YoY), reflecting diverging pricing dynamics by powertrain.
-
Retail inventory stands at 2.39M units (+11.7% YoY), equal to 70 days of supply, while retailer profit per unit declines to $1,974 (-$112 YoY), indicating improved availability alongside margin compression.
-
-
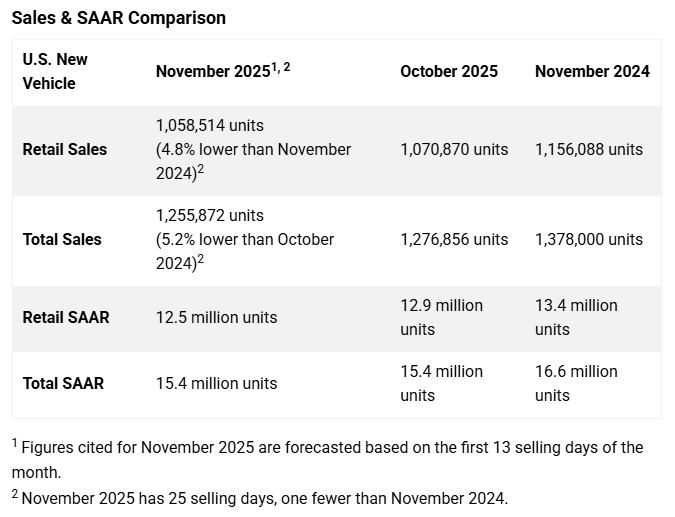
U.S. new-vehicle sales are forecast at 1.26M units in November 2025 (-5.2% YoY), with retail sales at 1.06M units (-4.8% YoY), reflecting continued payback from September’s EV pull-ahead ahead of expiring tax credits.
-
Total SAAR is expected at 15.4M units (Nov 2024: 16.6M), while retail SAAR is projected at 12.5M (Nov 2024: 13.4M), showing a slower underlying sales pace.
-
EV retail share is forecast at 6.0% (Sep: 12.9%; Nov 2024: 9.6%), while ICE share rises 2.3 ppt YoY to 77.5%, indicating a significant shift back toward conventional vehicles.
-
Average transaction prices are expected at $46,029 (+1.6% YoY), and average monthly finance payments at $760 (+$19 YoY), highlighting ongoing affordability pressures.
-
Incentive spending averages $3,211 (-$125 YoY), with EV discounts at $11,869 (+$260 YoY) and non-EV discounts at $2,960 (+$161 YoY), showing diverging pricing strategies.
-
Fleet sales are projected at 197,358 units (-7.5% YoY), representing 15.7% of total sales (-0.4 ppt YoY).
-
Retail inventory rises to 2.29M units (+11.7% YoY), equal to 64 days of supply (+5 days YoY), signaling gradually improving availability.
-
Used-vehicle prices average $29,696 (+$725 YoY), while average trade-in equity dips to $7,822 (-$111 YoY), with negative equity rising to 26.9% (+3.3 ppt YoY).
-
Retail buyers are expected to spend $46.8B on new vehicles (-6.4% YoY), while retailer profit per unit edges up to $2,161 (+$6 YoY).
-
-
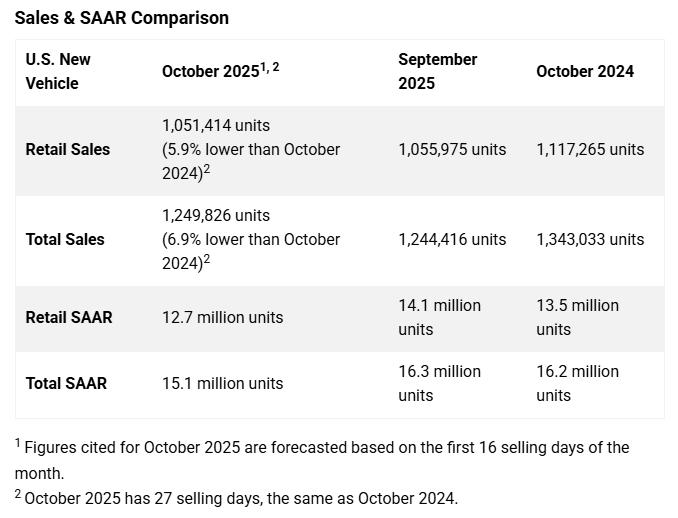
U.S. new-vehicle sales are forecast at 1.25M units in October 2025 (-6.9% YoY), with retail sales at 1.05M units (-5.9% YoY), reflecting a sharp pullback following last month’s EV-driven surge from pre-expiration tax credit purchases.
-
The total SAAR is expected at 15.1M units (Sep: 16.3M; Oct 2024: 16.2M), while retail SAAR is 12.7M (Sep: 14.1M; Oct 2024: 13.5M).
-
EVs are projected to account for just 5.2% of retail sales, down -7.7 ppt MoM and -3.4 ppt YoY, reversing September’s pre-credit pull-forward; ICE share rose to 79.2% (+2.4 ppt YoY).
-
Fleet sales are forecast at 198K units (-12.1% YoY), representing 15.9% of total sales (-0.9 ppt YoY).
-
Average retail transaction price rose +2.2% YoY to $46,057, while incentive spending fell -$444 YoY to $2,674 (5.3% of MSRP, -1 ppt YoY).
-
EV discounts averaged $13,161 (+$2,211 YoY), partially offsetting the loss of the federal credit; non-EV incentives fell to $2,423 (-$282 YoY).
-
Average monthly finance payments reached $758 (+$21 YoY), while average loan rates eased slightly to 6.56% (-14 bps YoY).
-
Retail inventory rose +11.5% YoY to 2.27M units, equal to 61 days of supply (up from 59 days).
-
Used-vehicle prices averaged $29,446 (+$473 YoY), and average trade-in equity rose to $8,378 (+$386 YoY), though 26.6% of trade-ins carried negative equity (+2.2 ppt YoY).
-
Total consumer spending on new vehicles is expected at $46.1B (-4.2% YoY), while total retailer profit per unit rose to $2,295 (+$97 YoY).
-
-
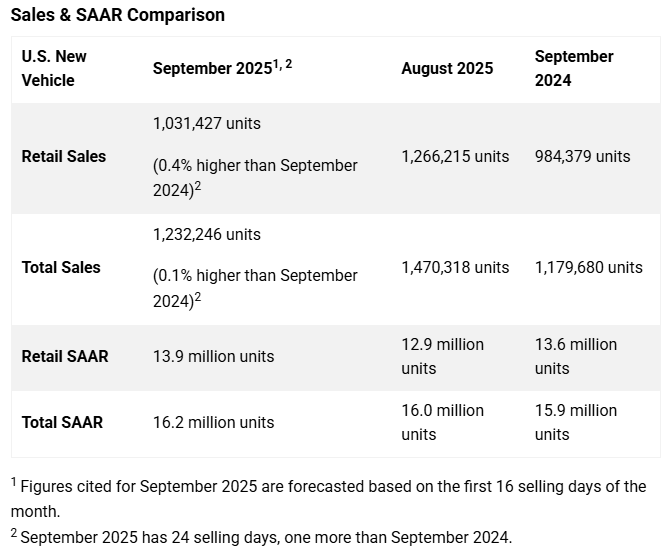
US new-vehicle sales are projected at 1.23 million units in September 2025 (+0.1% YoY; SAAR: 16.2 million), with retail sales at 1.03 million (+0.4% YoY), reflecting steady demand supported by EV purchases ahead of tax credit expiration.
-
EVs are expected to account for 12.2% of retail sales (+2.6 ppt YoY), with selling-day adjusted EV sales up +27.5% YoY, while non-EV sales declined -2.5% YoY.
-
ICE vehicles’ share is projected at 71.7% (-4.9 ppt YoY), while HEVs rise to 12.4% (+0.7 ppt YoY) and PHEVs to 2.6% (+0.5 ppt YoY).
-
Fleet sales are expected at 200,819 units (-1.5% YoY), representing 16.3% of total sales (-0.3 ppt YoY).
-
Average retail transaction price is projected at $45,795 (+2.9% YoY), while incentive spending per vehicle is $3,116 (6.1% of MSRP, -0.2 ppt YoY).
-
Average monthly finance payments reached $756 (+$21 YoY), the highest on record for September, with 84-month loan terms at 11.0% of sales (+1.5 ppt YoY).
-
Retail inventory is estimated at 2.21 million units (+17.5% YoY), with industry days’ supply at 60 (vs 54 a year ago).
-
Used-vehicle prices are trending at $29,668 (+$739 YoY), pushing average trade-in equity to $8,430 (+$534 YoY), though negative equity among trade-ins rose to 25.9% (+1.5 ppt YoY).
-
Total consumer spending on new vehicles is forecast at $45 billion (+8.5% YoY), the second-highest September on record, while aggregate retailer profit is expected at $2.2 billion (+6.0% YoY).
-
-
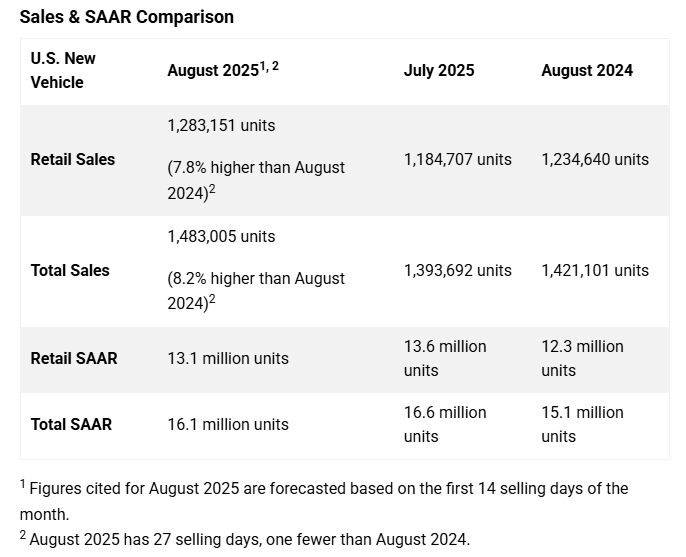
US new-vehicle sales are projected to rise +8.2% YoY in August 2025 to 1.48 million units (SAAR: 16.1M), while retail sales are expected to increase +7.8% YoY to 1.28 million units, supported by accelerated EV demand ahead of expiring tax credits.
-
EV retail share is expected at 12.0% (vs 9.5% Aug 2024), while ICE vehicle share falls to 72.2% (-5.6 pp YoY); hybrids (HEV +2.0 pp, PHEV +0.6 pp) also gained share.
-
Fleet sales are forecast at 199,854 units (+11.2% YoY), making up 13.5% of total sales (+0.4 pp YoY).
-
The average transaction price is expected at $44,750, up +2.2% YoY, while average incentive spending is $3,105 per unit (+$38 YoY), equal to 6.2% of MSRP (-0.1 pp YoY).
-
Retail inventory stands at 2.10M units (+18.6% YoY), with days’ supply rising to 58 (vs 51 a year ago); trucks/SUVs make up 82.0% of retail sales (+2.1 pp YoY).
-
Consumers are set to spend $54.6B on new vehicles (+5.3% YoY), with average monthly finance payments at $743 (+$13 YoY) and interest rates at 6.40% (-38 bps YoY).
-
-
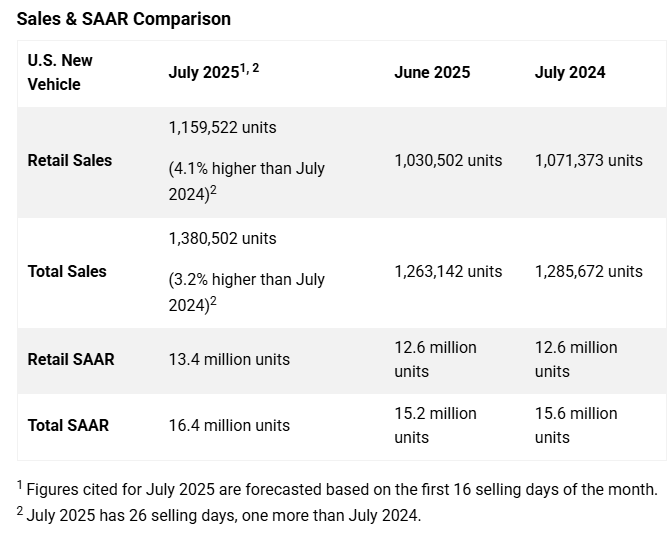
US new-vehicle retail sales are projected to rise 4.1% YoY in July 2025 to 1.16 million units (SAAR: 13.4 million), while total sales are expected to increase 3.2% YoY to 1.38 million units (SAAR: 16.4 million).
- Consumers are projected to spend a record $49.8 billion on new vehicles in July, up 11.3% YoY, with the average transaction price up 2.1% YoY to $45,063.
- Fleet sales are expected to fall -0.8% YoY to 221k units, accounting for 16.0% of total sales (down from 20.0%).
- EVs are projected to make up 10.9% of retail sales (+1.6 pp YoY), while ICE vehicle share declines to 74.0% (-3.7 pp YoY).
- Incentive spending is expected to average $3,051 per unit (+$52 YoY), but as a % of MSRP, incentives slipped -0.1 pp to 6.1%.
- Average monthly finance payments rose to $742 (+$12 YoY), while the average interest rate dipped 30 bps to 6.54%.
-
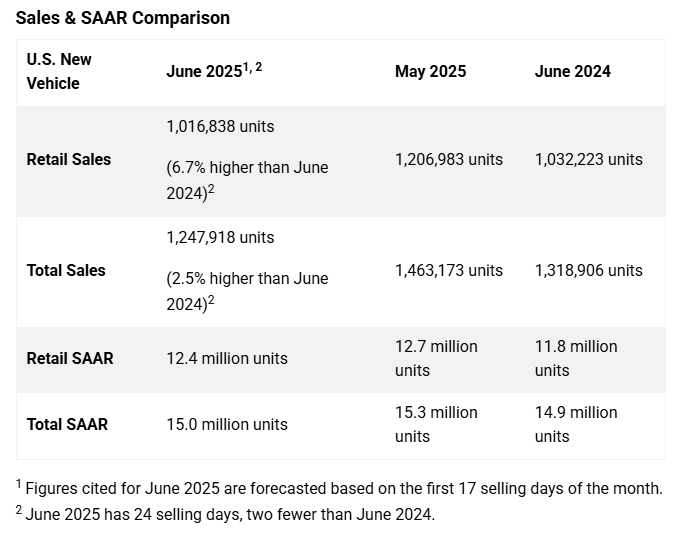
US new-vehicle sales are projected to rise 2.5% YoY in June 2025 to 1.25 million units (SAAR: 15.0 million), while retail sales are up 6.7% YoY to 1.02 million (SAAR: 12.4 million), despite fewer selling days and post-tariff payback effects.
- Consumers are expected to spend $45.0 billion on new vehicles in June, up 4.3% YoY, with the average transaction price at $46,233 (+3.1% YoY).
- Fleet sales are projected to fall -12.7% YoY to 231k, making up 18.5% of total sales (down from 21.7%).
- EVs are expected to make up 8.7% of retail sales (down -1.6 pp YoY), while ICE vehicles remain dominant at 75.8%.
- Average incentive spending is up to $2,727 (+$39 YoY), but as a % of MSRP, incentives declined -0.1 pp to 5.4%.
- Retail inventory rose 22.9% YoY to 2.16 million units; average days’ supply increased to 54 (from 49 last year).
-
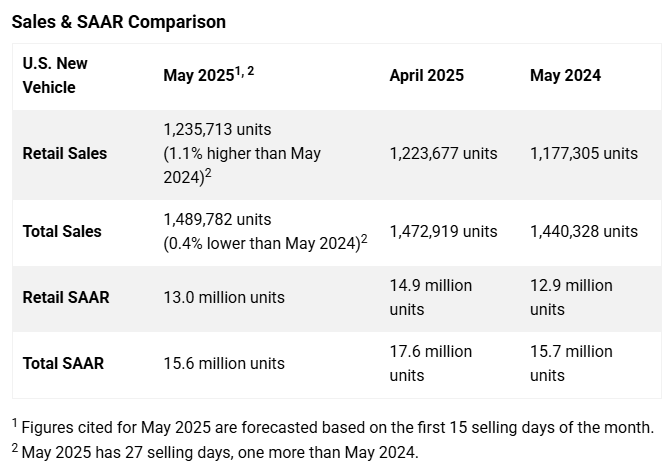
US new-vehicle retail sales are projected to rise 1.1% YoY in May 2025 to 1,235,700 units, while total sales are flat YoY at 1,489,800 units; the SAAR for total sales is expected at 15.6 million, slightly down from 15.7 million last May.
- Consumers are set to spend a record $53.8 billion on new vehicles in May (+7.0% YoY), with the average retail transaction price at $45,462 (+$649 YoY, but down -$592 from April).
- Average monthly loan payments are expected at $748 (+$21 YoY), with the average interest rate at 6.93% (-10 bps YoY).
- Fleet sales are projected to decline -7.0% YoY, making up 17.1% of total sales (down from 18.3%).
- Electrified vehicles (HEV, PHEV, EV) make up 25% of retail sales, with HEVs rising to 14.8% share (+4.3 pp YoY) and EVs falling slightly to 8.1% (-0.4 pp).
- Inventory levels are up 23.0% YoY to 2.13 million units; days of supply stands at 57 days (+7 YoY).