J.D. Power Automotive Forecast
- Source
- J.D. Power
- Source Link
- https://www.jdpower.com/
- Frequency
- Monthly
- Next Release(s)
- March 19th, 2026 10:00 AM
Latest Updates
-
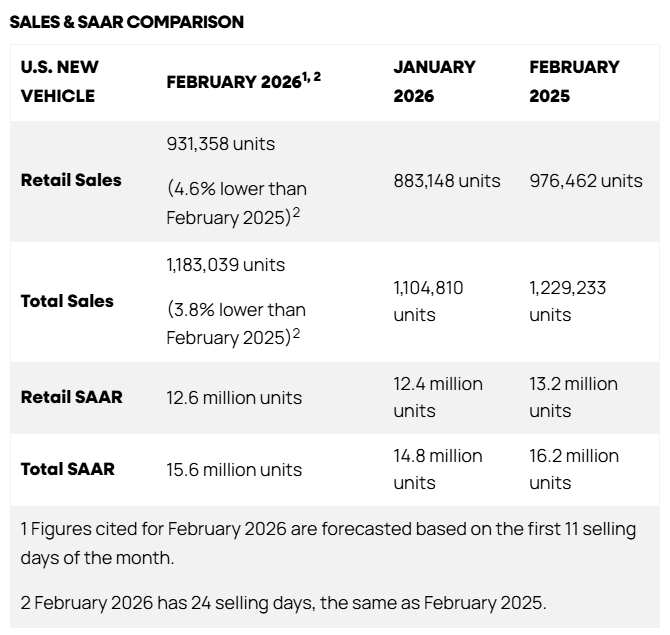
U.S. total new-vehicle sales are forecast at 1.183M units in February (-3.8% YoY) with retail sales -4.6% YoY, indicating weaker annual demand despite seasonal improvement.
-
Total sales SAAR is 15.6M (vs 16.2M in February 2025) and retail sales SAAR is 12.6M (vs 13.2M), showing softer annualized sales momentum.
-
EV share is 6.6% (-1.8 ppts YoY) while ICE rises to 78.7% (+2.6 ppts) and HEV 13.5% (+0.1 ppt), reflecting a shift away from EVs.
-
Average retail transaction price is $46,303 (+2.7% YoY); non-EV prices $46,097 (+3.0%) and EV prices $46,528 (+2.6%), indicating continued price pressures.
-
Average monthly payment is $811 (+$32 YoY) while loan rates fell to 6.72% (-31 bps YoY) and 84-month loans rose to 12.7% (+1.8 ppts), suggesting affordability strain despite easing rates.
-
Incentive spending averages $3,293 (+$63 YoY); EV discounts $10,356 (-$1,664 YoY) and non-EV discounts $3,085 (+$346 YoY), showing incentives shifting toward non-EV vehicles.
-
Inventory stands at 2.19M units (+1.4% YoY) with 65 days supply and retailer profit per unit $2,524 (+$83 YoY), while total consumer spending is $41.3B (-2.4% YoY), indicating higher per-unit profitability but lower aggregate sales value.
-
Used vehicle prices average $29,488 (+$448 YoY) and trade-in equity is $7,013 (roughly flat YoY), suggesting continued strength in the used market supporting trade-ins.
-
Share of buyers with negative equity is 31.5% (+3.4 ppts YoY), indicating more households carrying loan balances into new purchases.
-
Fleet sales total 251,681 units (-0.4% YoY) and represent 21.3% of sales (+0.7 ppts), showing a slightly larger fleet share within overall volumes.
-
-
J.D. Power Automotive Forecast: March 2025