FHFA House Price Index
- Source
- Federal Housing Finance Agency
- Source Link
- https://www.fhfa.gov/
- Frequency
- Monthly
- Next Release(s)
- February 24th, 2026 9:00 AM
-
March 31st, 2026 9:00 AM
-
April 28th, 2026 9:00 AM
-
May 26th, 2026 9:00 AM
-
June 30th, 2026 9:00 AM
-
July 28th, 2026 9:00 AM
-
August 25th, 2026 9:00 AM
-
September 29th, 2026 9:00 AM
-
October 27th, 2026 9:00 AM
-
November 24th, 2026 9:00 AM
-
December 29th, 2026 9:00 AM

Latest Updates
-
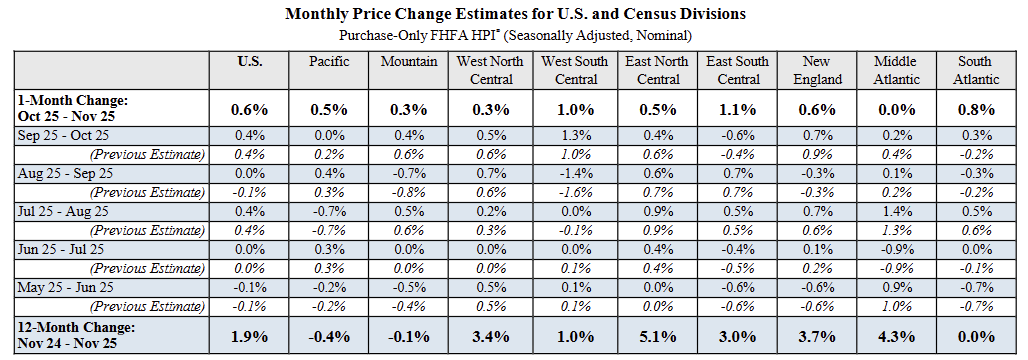
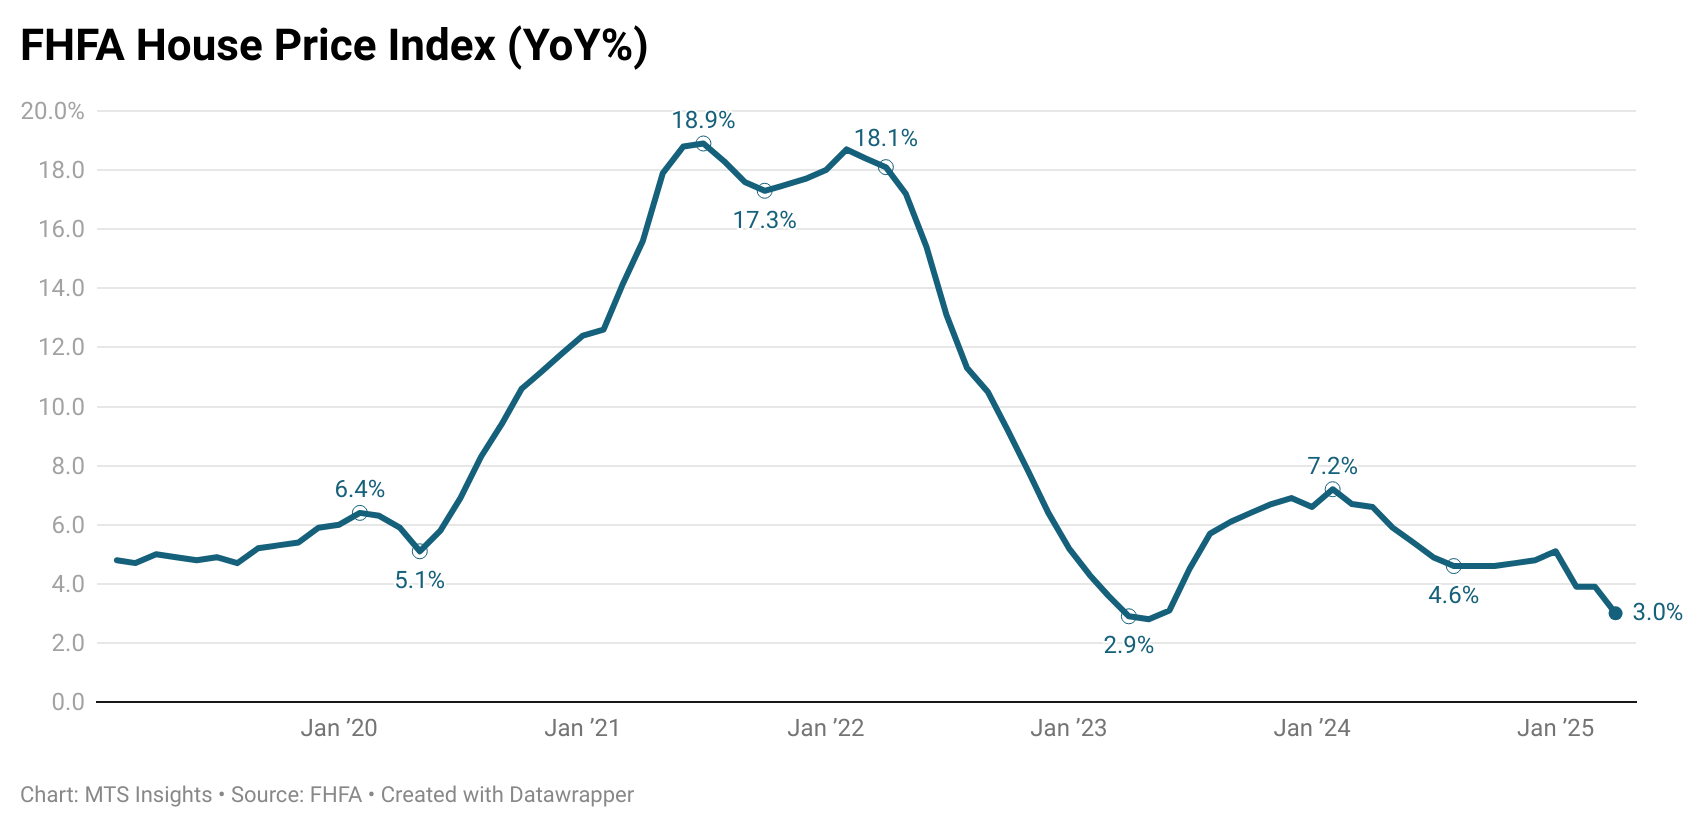
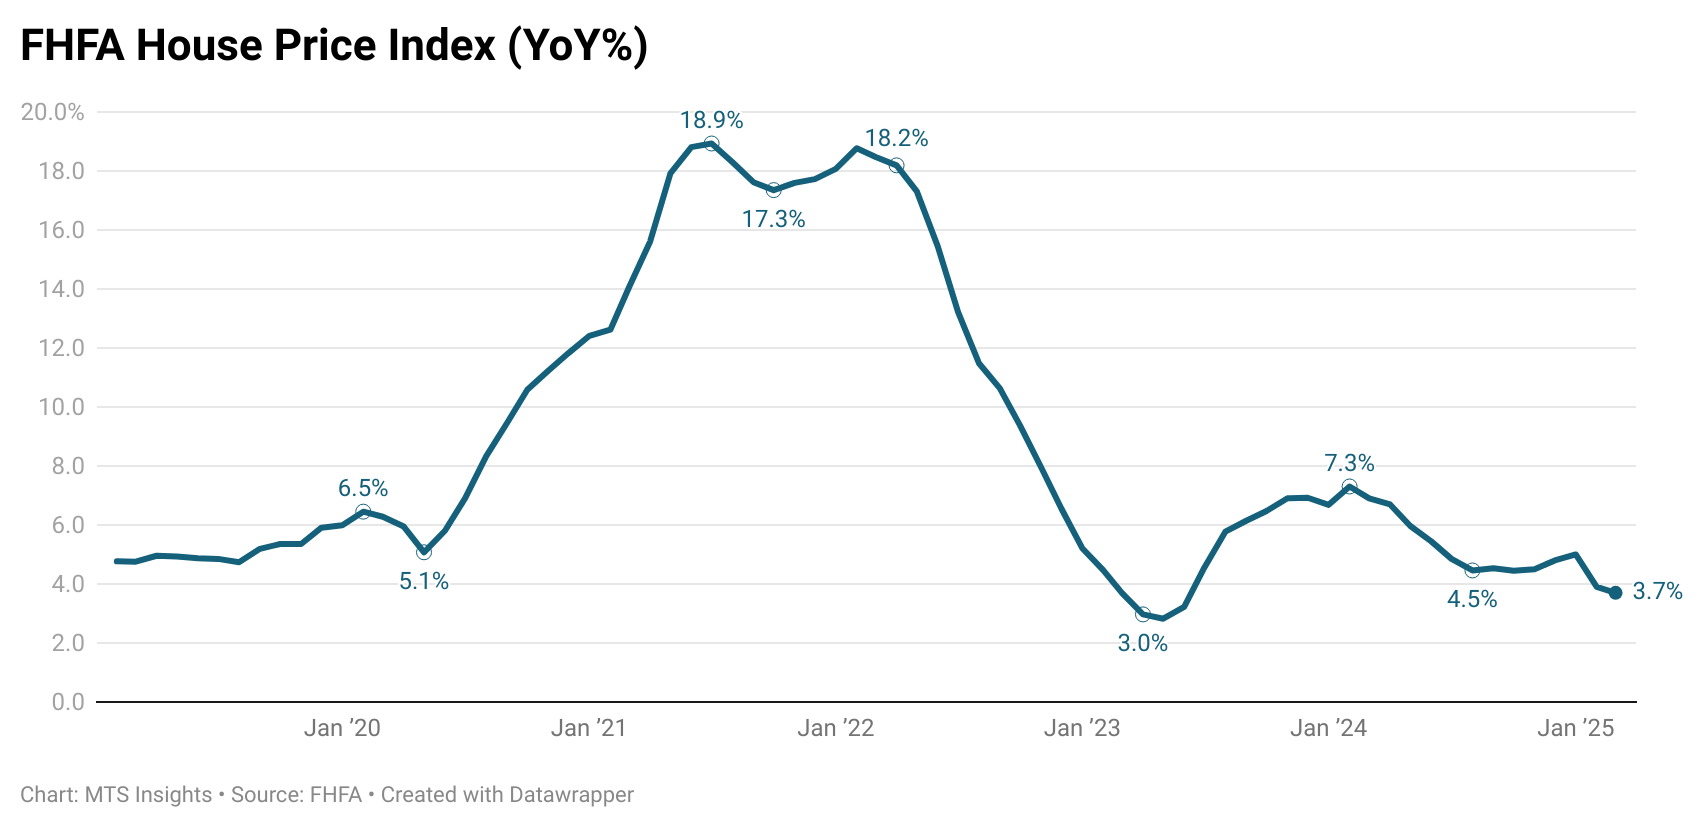
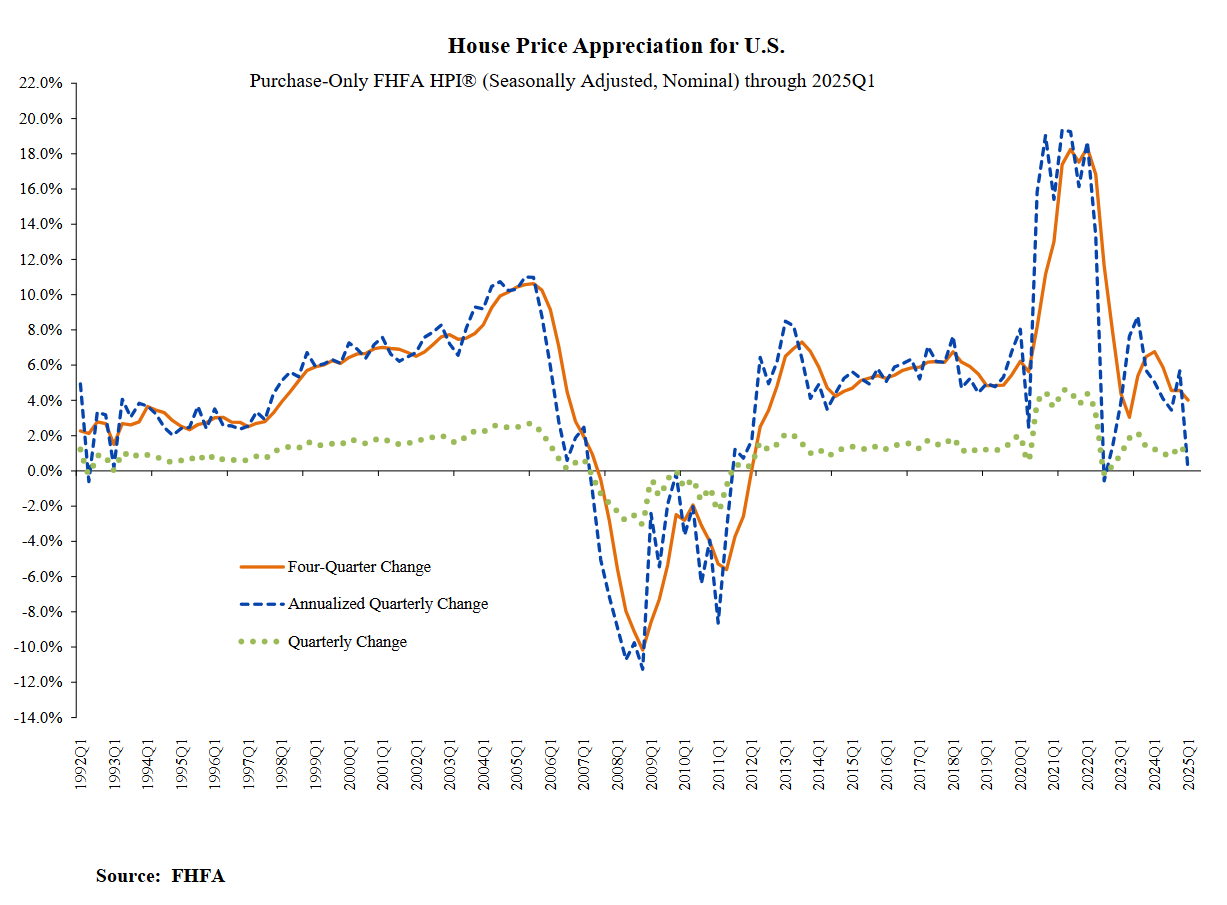
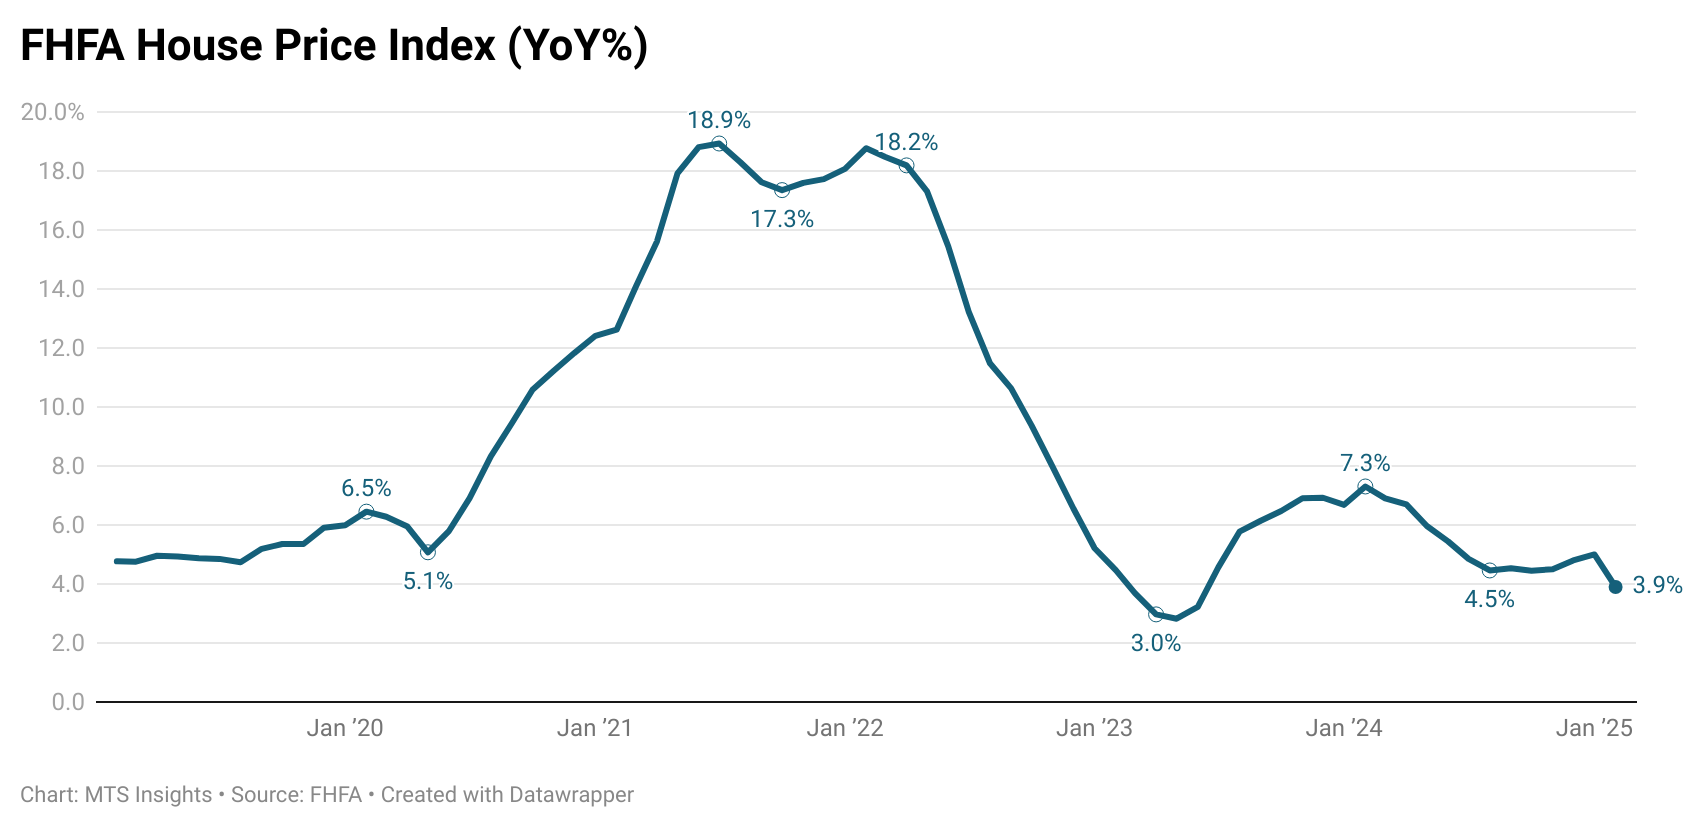
U.S. house prices rose +0.6% MoM (vs +0.3% MoM expected) and +1.9% YoY in November 2025, showing modest monthly gains with soft annual growth.
-
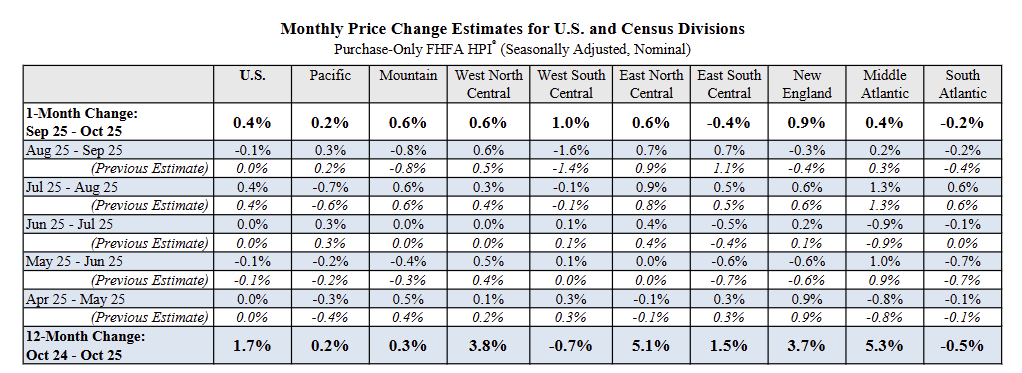
The national FHFA purchase-only HPI increased +0.6% MoM from Oct–Nov 2025, up from +0.4% MoM in Sep–Oct (unrevised), indicating slightly firmer monthly price momentum.
-
Regional monthly gains ranged from +0.0% in the Middle Atlantic to +1.1% in the East South Central, highlighting continued dispersion in short-term price movements.
-
The West South Central division posted a +1.0% MoM increase, while the Pacific and East North Central divisions both rose +0.5% MoM, reflecting broader participation in monthly growth.
-
Over the past 12 months, national prices increased +1.9% YoY in November 2025, up from +1.7 YoY in October 2025.
-
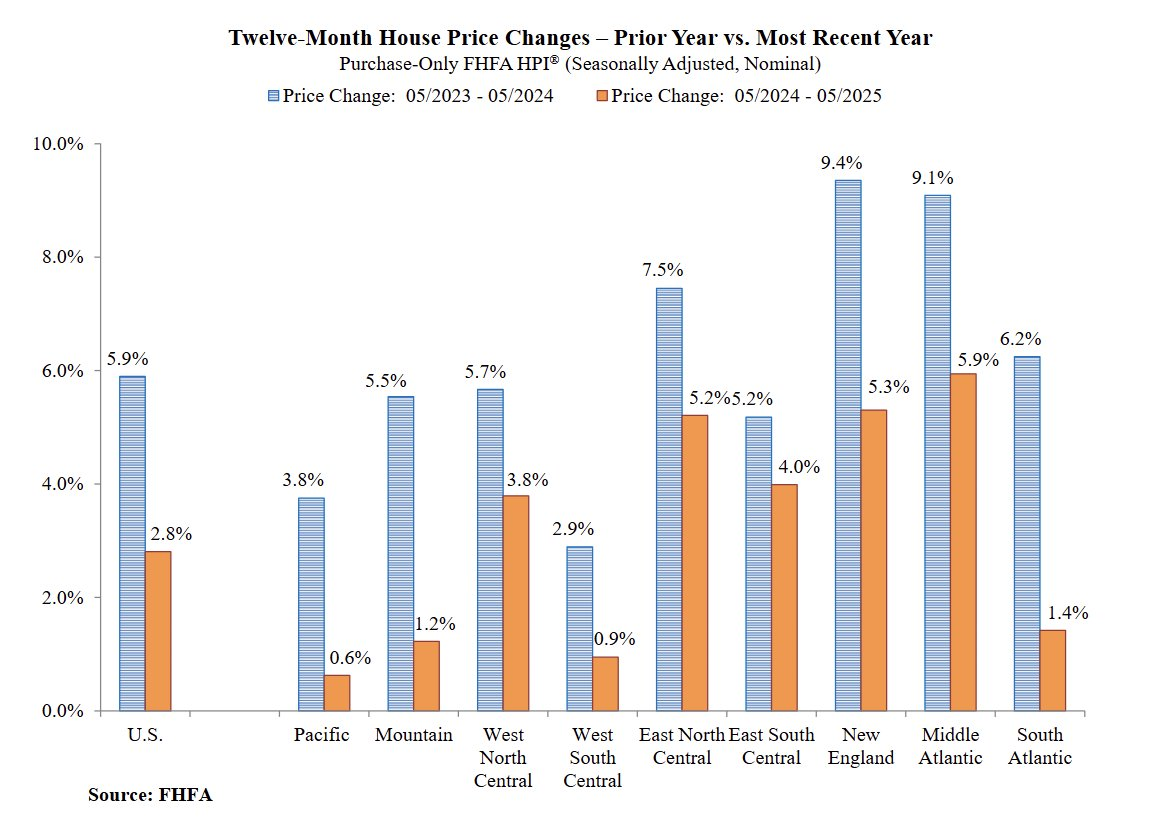
Year-over-year changes varied widely by region, from -0.4% YoY in the Pacific and -0.1% YoY in the Mountain to +5.1% YoY in the East North Central and +4.3% YoY in the Middle Atlantic.
-
Several regions posted moderate annual gains, including +3.7% YoY in New England and +3.0% YoY in the East South Central, while the South Atlantic was flat at 0.0% YoY.
-