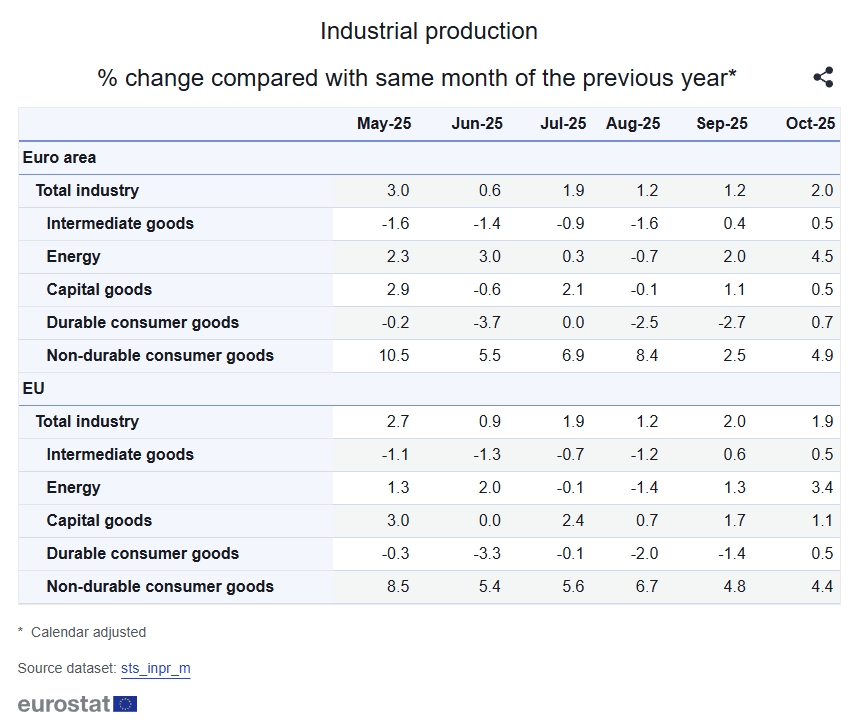
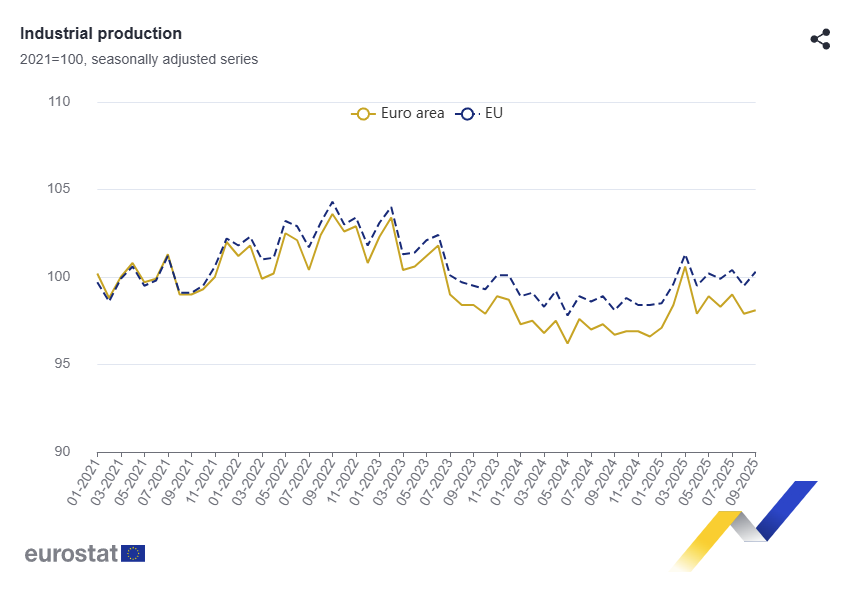
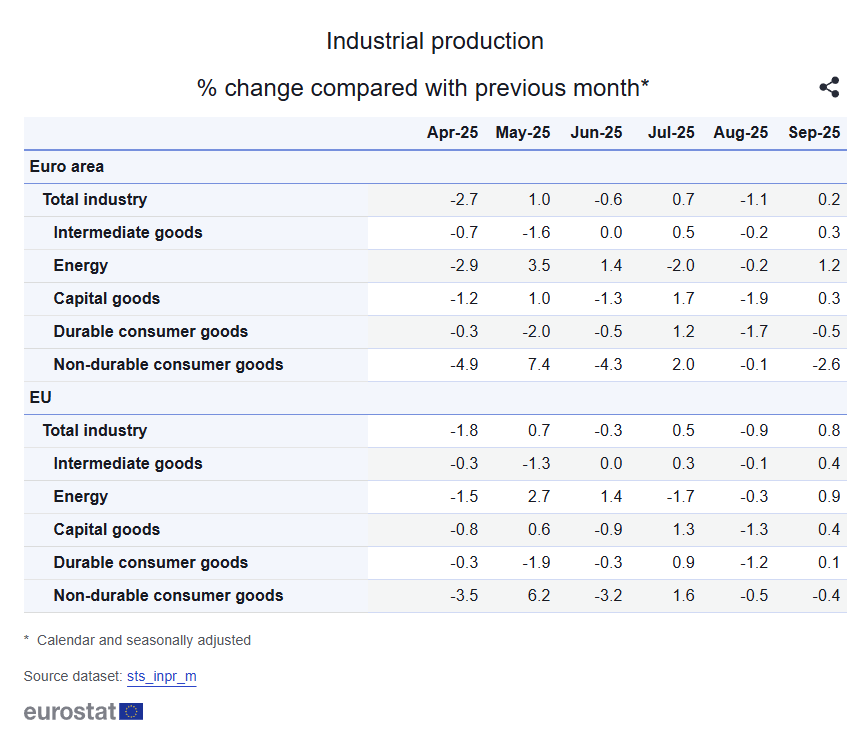
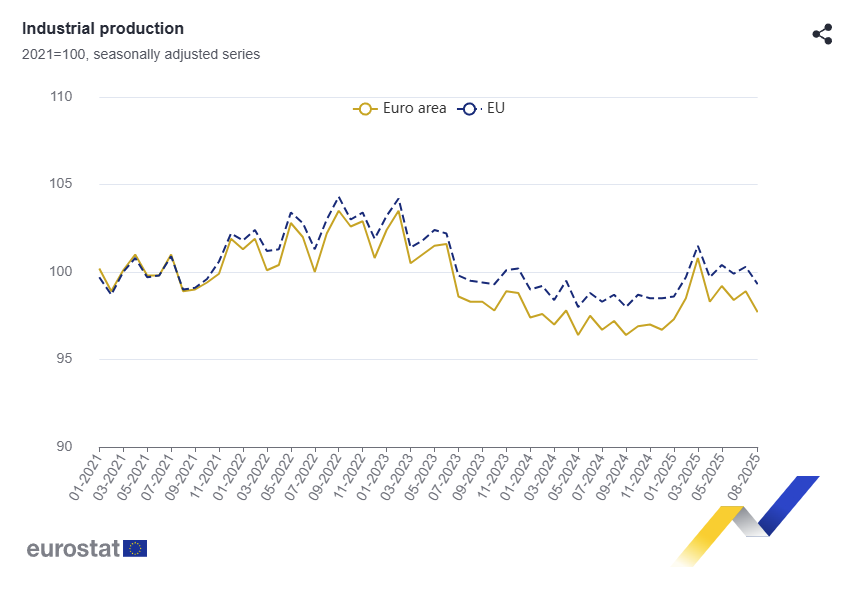
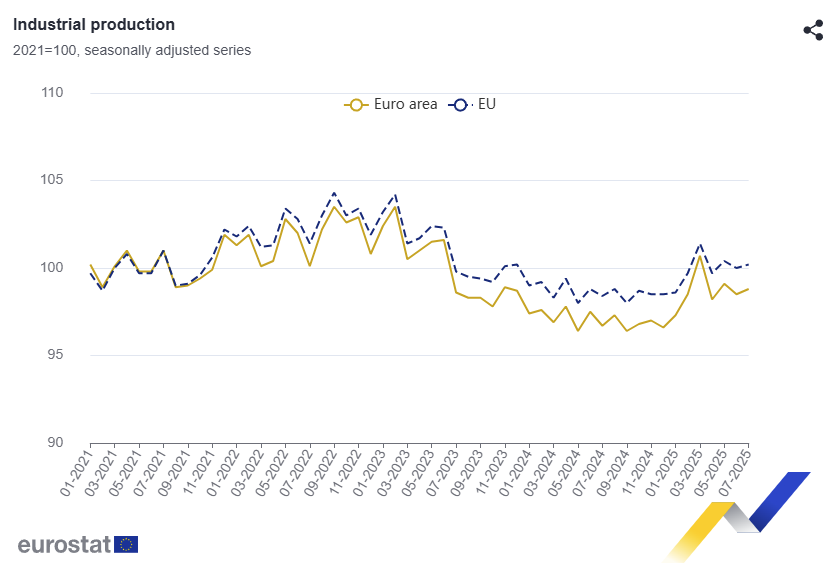
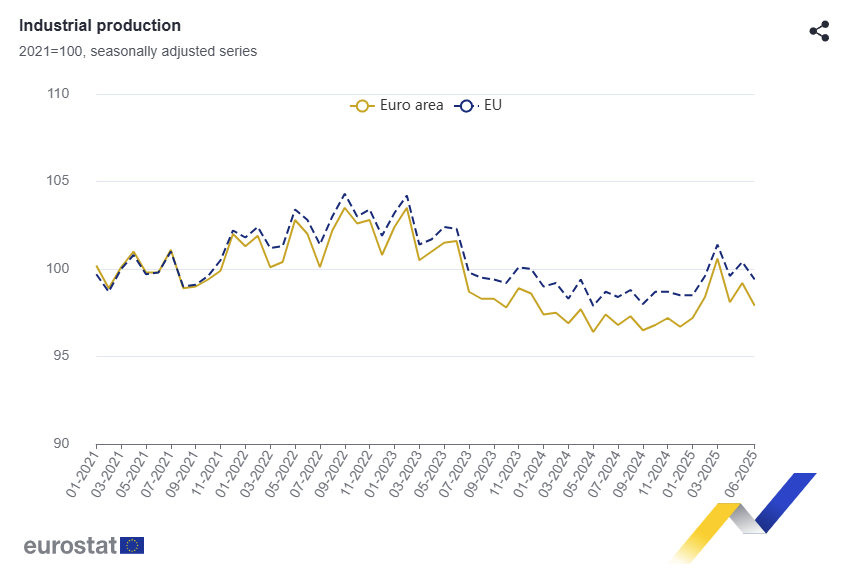
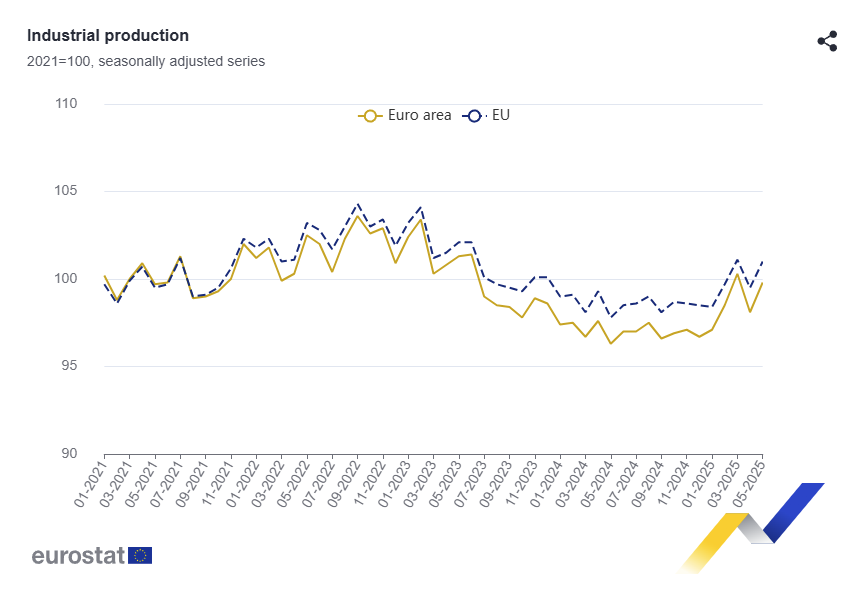
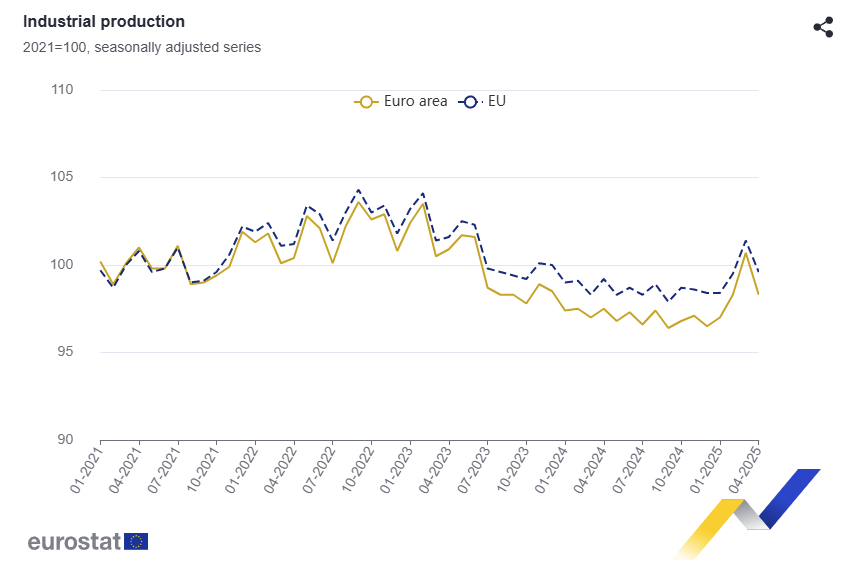
Euro Area Industrial Production
Data
Industry
- Source
- Eurostat
- Source Link
- https://ec.europa.eu/
- Frequency
- Monthly
- Next Release(s)
- September 16th, 2025 5:00 AM
Latest Updates
-
Euro area industrial production fell -1.3% MoM in June 2025 (EU -1.0% MoM) after rising in May, but was up +0.2% YoY (EU +0.5% YoY).
- MoM, energy output rose (+2.9% EA; +2.7% EU), while non-durable goods (-4.7% EA; -3.7% EU), capital goods (-2.2% EA; -1.7% EU), intermediate goods (-0.2% EA/EU) and durable goods (-0.6% EA; -0.4% EU) declined.
- Largest MoM drops: Ireland (-11.3%), Portugal (-3.6%), Lithuania (-2.8%); biggest gains: Belgium (+5.1%), France & Sweden (+3.8%), Greece (+3.3%).
- YoY, non-durable goods rose (+5.8% EA; +5.3% EU) and energy output increased (+4.6% EA; +3.5% EU); capital goods (-2.1% EA; -1.3% EU), intermediate goods (-1.8% EA; -1.6% EU) and durable goods (-4.0% EA; -3.5% EU) fell.
- Largest YoY gains: Sweden (+13.4%), Ireland (+10.5%), Latvia (+7.3%); biggest declines: Bulgaria (-8.2%), Hungary (-4.9%), Slovenia (-4.3%).