Euro Area HICP Inflation
- Source
- Eurostat
- Source Link
- https://ec.europa.eu/
- Frequency
- Monthly
- Next Release(s)
- March 18th, 2026 5:00 AM
-
March 31st, 2026 5:00 AM
-
April 16th, 2026 5:00 AM
-
April 30th, 2026 5:00 AM
-
May 20th, 2026 5:00 AM
-
June 2nd, 2026 5:00 AM
-
June 17th, 2026 5:00 AM
-
July 1st, 2026 5:00 AM
-
July 17th, 2026 5:00 AM
-
July 31st, 2026 5:00 AM
-
August 19th, 2026 5:00 AM
-
September 1st, 2026 5:00 AM
Latest Updates
-
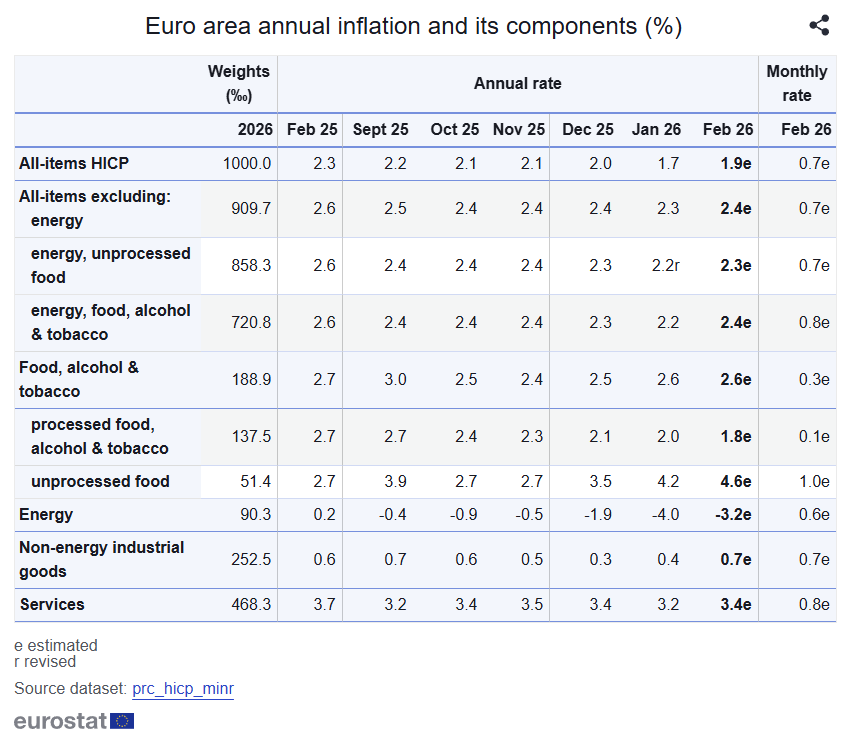
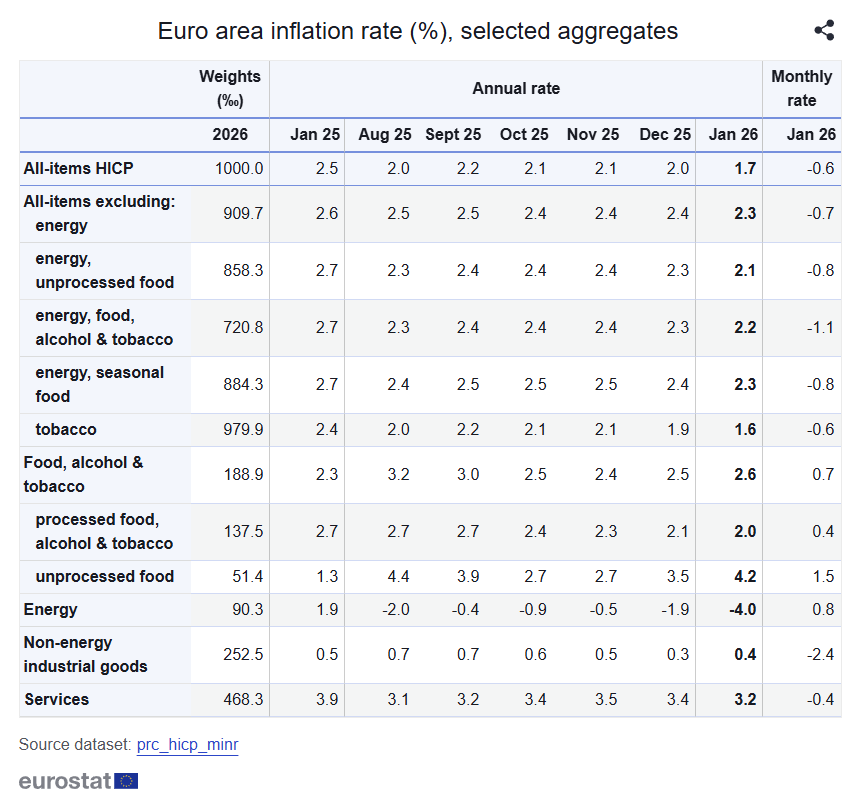
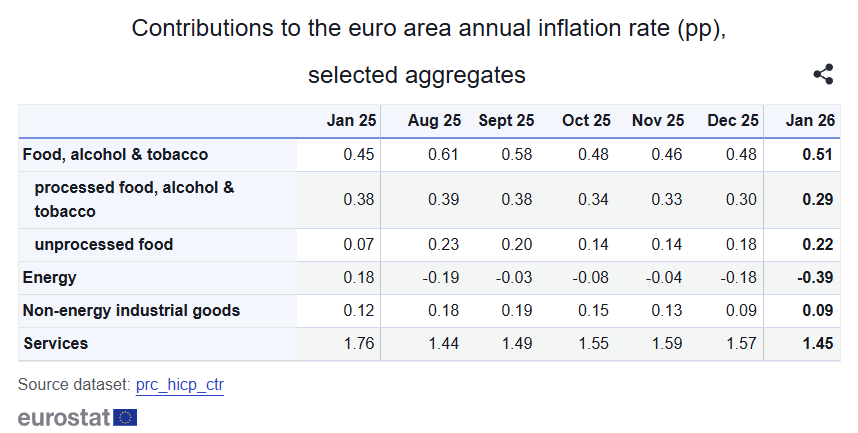
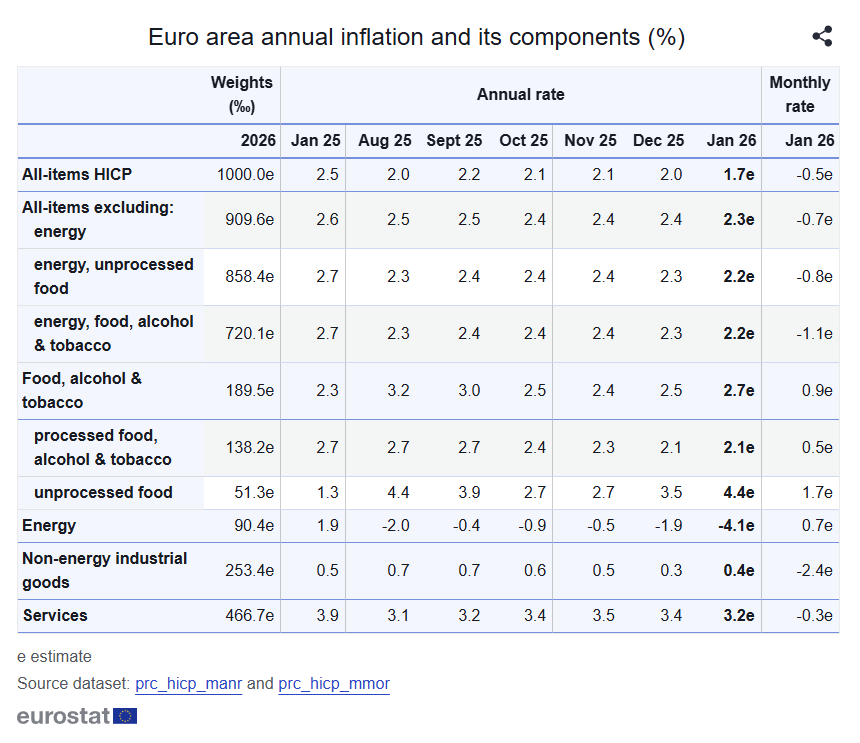
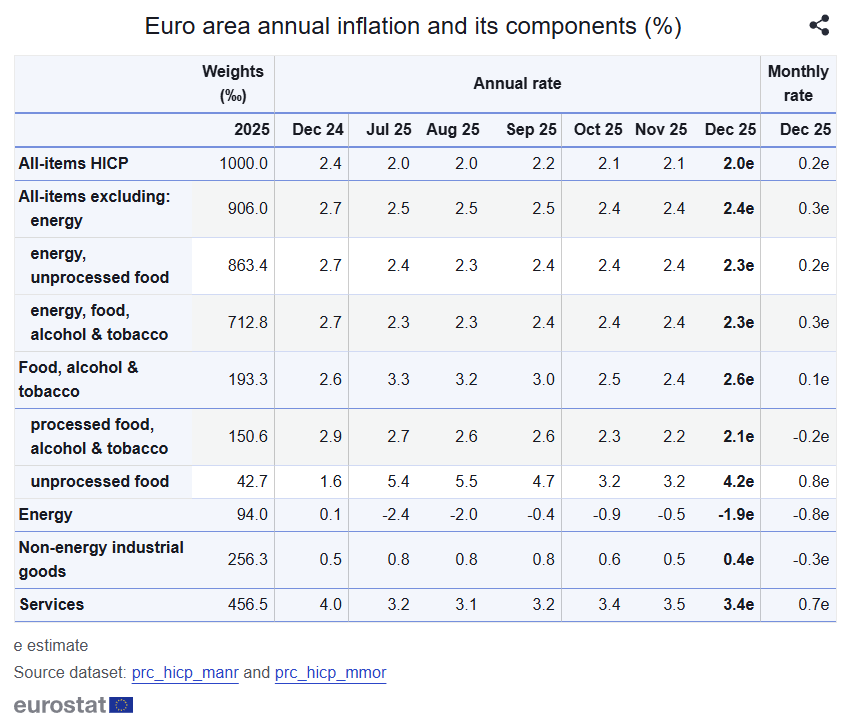
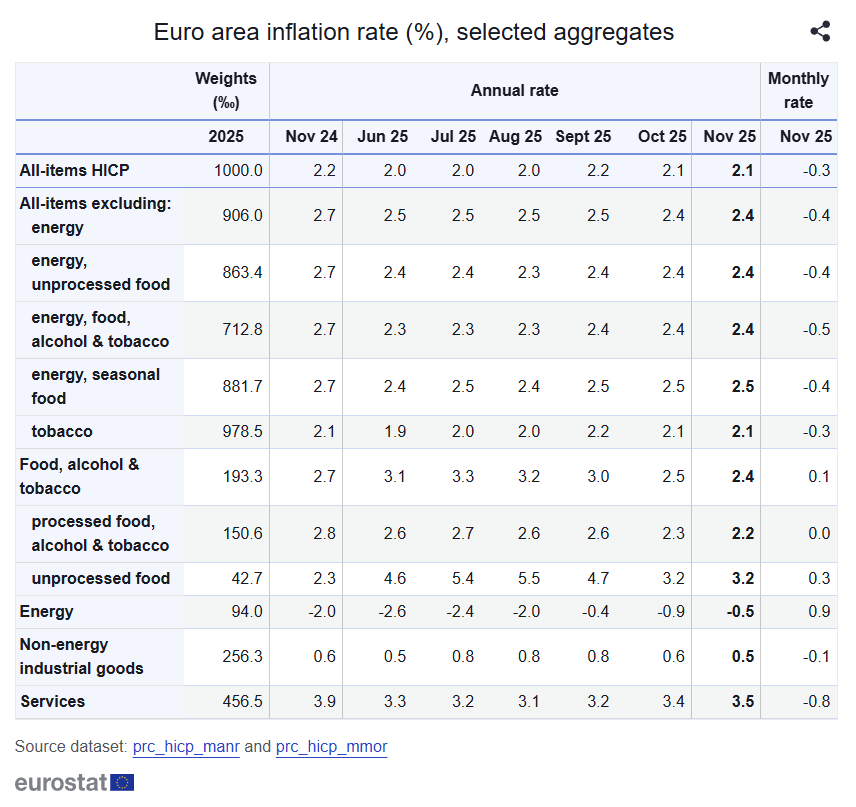
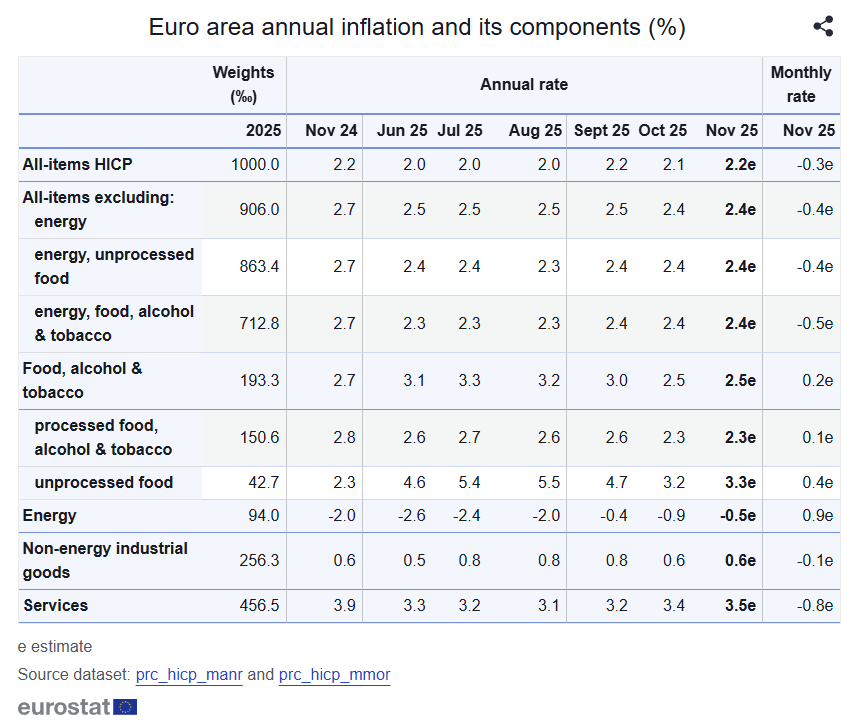
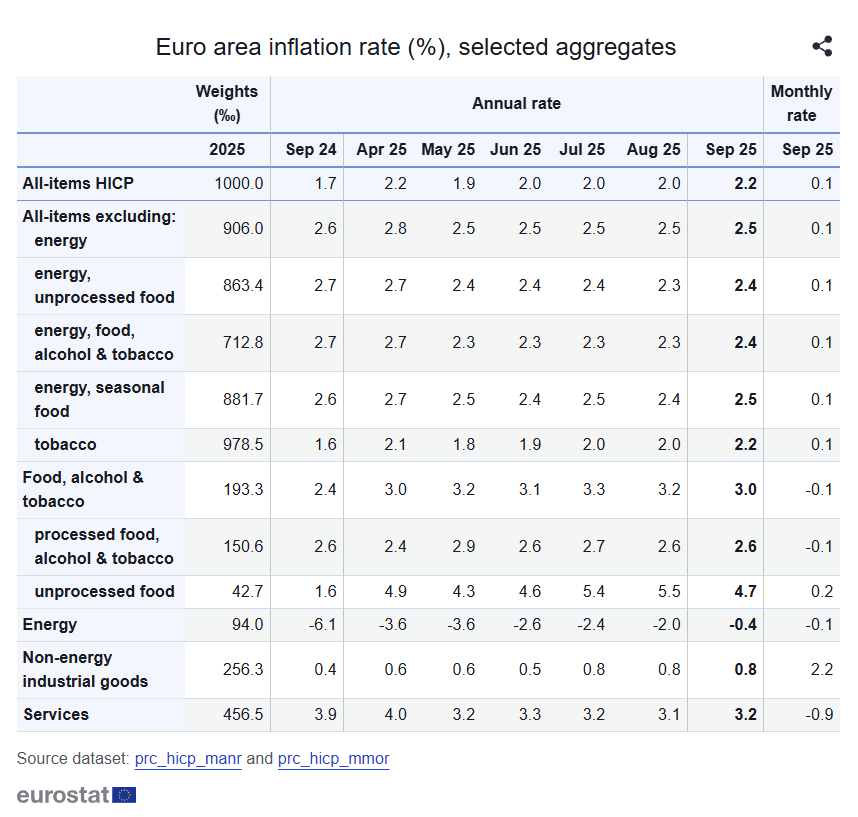
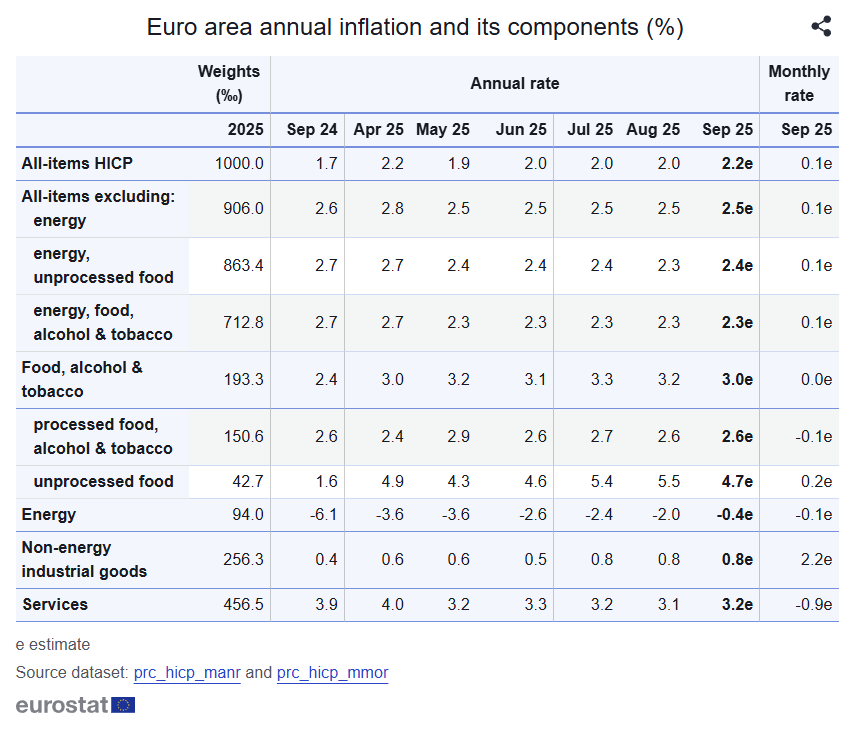
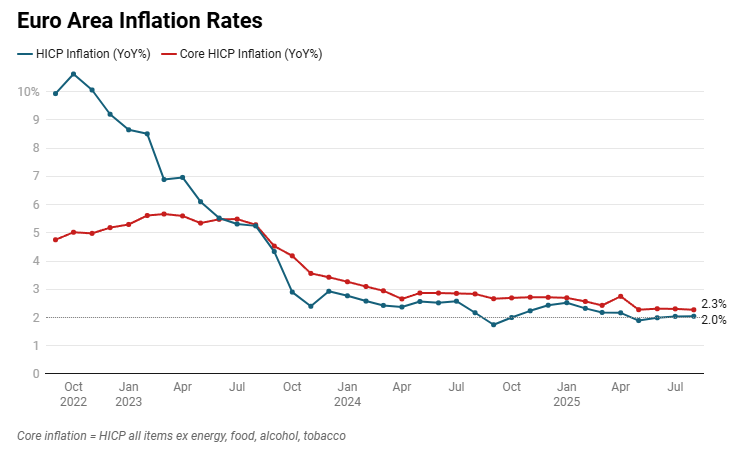
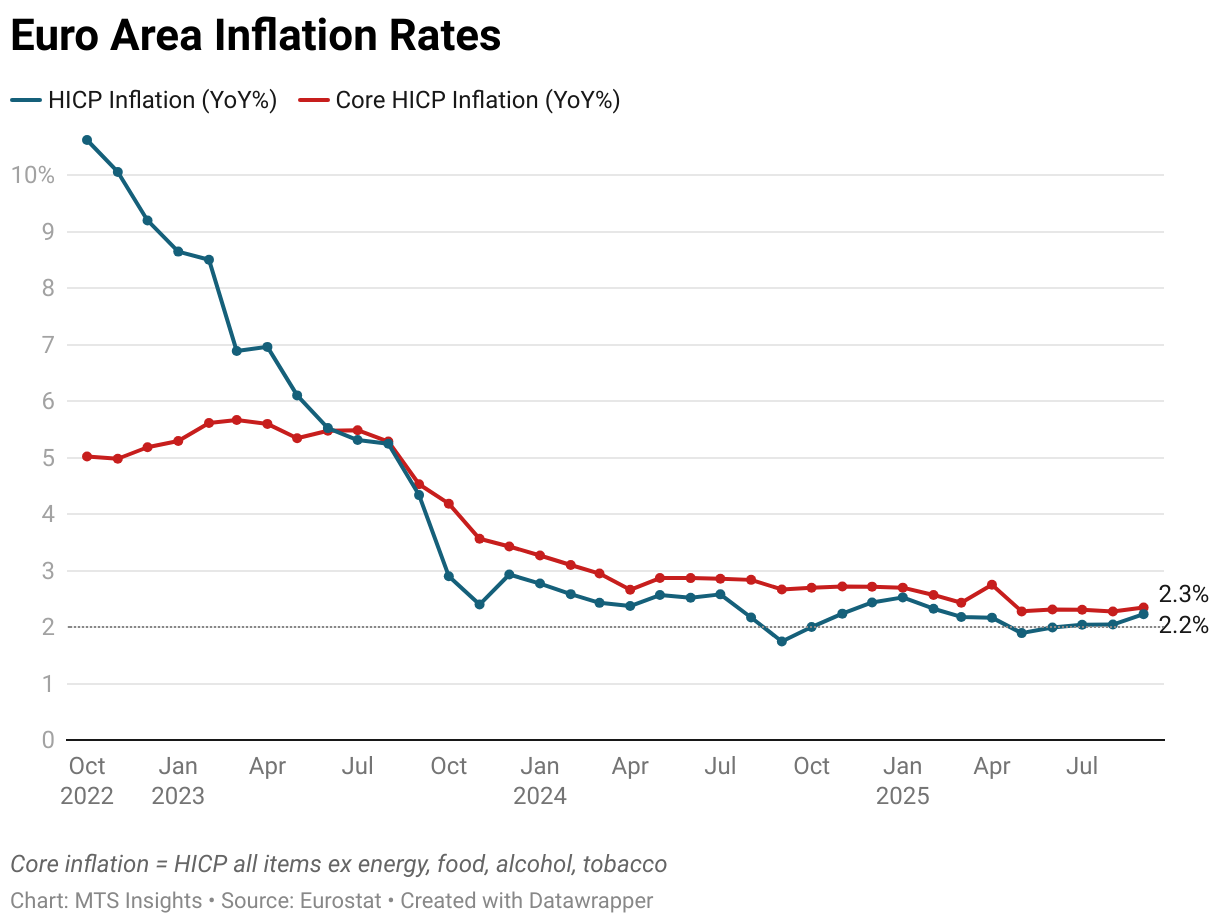
Euro area HICP inflation rose to 1.9% YoY in February 2026 (Jan: 1.7%) and increased +0.7% MoM, indicating a modest reacceleration in headline prices driven by food and services alongside a smaller energy drag.
-
HICP excluding energy accelerated to 2.4% YoY (Jan: 2.3%) with a +0.7% MoM gain, showing slightly firmer underlying inflation once volatile energy is removed.
-
Core inflation excluding energy, food, alcohol and tobacco increased to 2.4% YoY (Jan: 2.2%) and rose +0.8% MoM, marking an uptick in broader underlying price pressures.
-
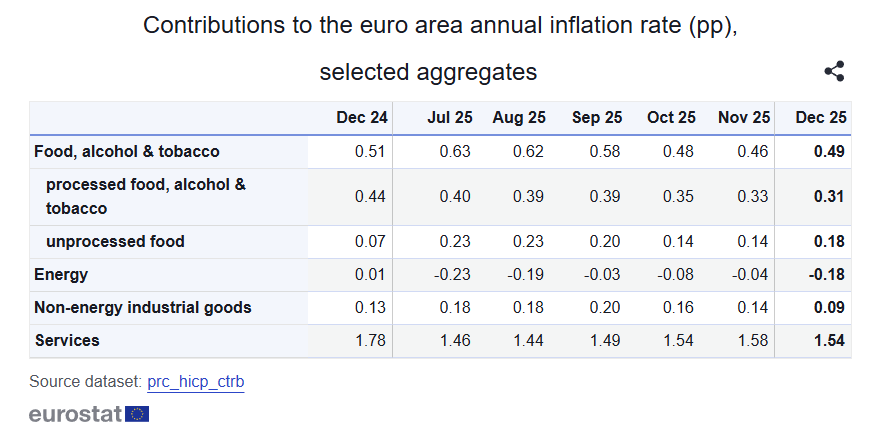
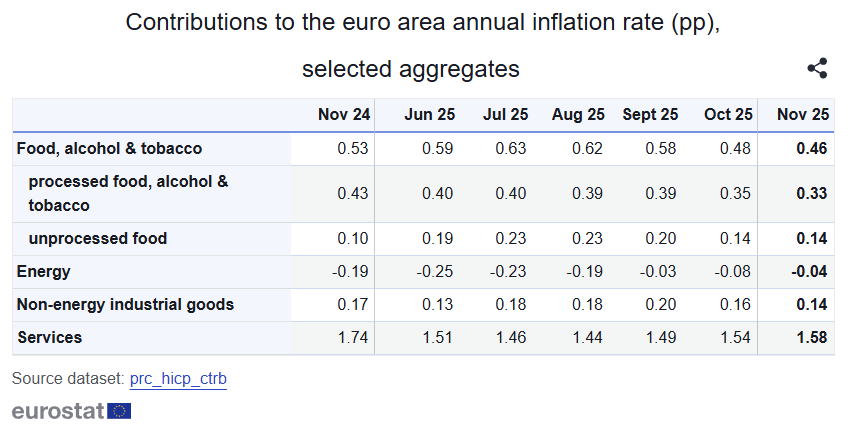
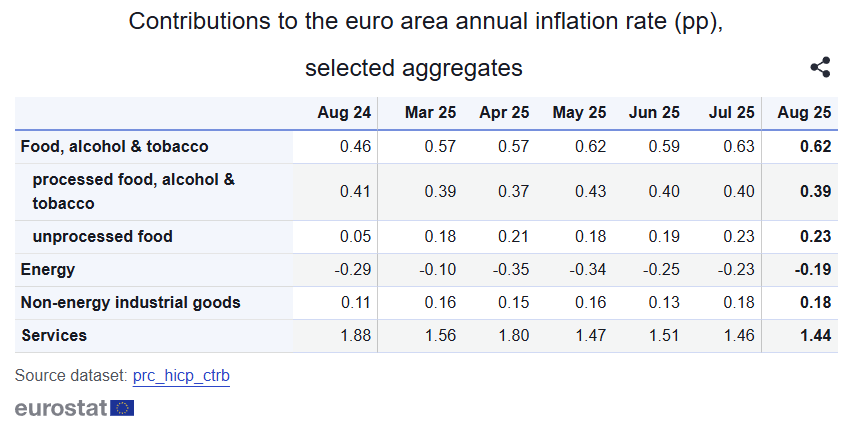
Food, alcohol and tobacco inflation held at 2.6% YoY (Jan: 2.6%) and rose +0.3% MoM, with divergent trends inside the category.
-
Unprocessed food inflation accelerated to 4.6% YoY (Jan: 4.2%) and increased +1.0% MoM, representing the strongest annual pace among major components.
-
Processed food, alcohol and tobacco inflation eased to 1.8% YoY (Jan: 2.0%) and rose just +0.1% MoM, indicating moderation within the processed segment.
-
Energy prices remained in annual contraction at -3.2% YoY (Jan: -4.0%) despite a +0.6% MoM increase, continuing to weigh on the headline rate even as the drag narrowed.
-
Services inflation edged up to 3.4% YoY (Jan: 3.2%) with a +0.8% MoM rise, while non-energy industrial goods increased to 0.7% YoY (Jan: 0.4%) and +0.7% MoM, highlighting firmer momentum across both services and goods components.
-