
2026-06-16 · 10:00
Cox Automotive EV Market Monitor: May 2026

Cox Automotive EV Market Monitor
Data
Transportation
About
Next Release
July 16th, 2026 · 10:00 AM
Latest Releases
12
2026-05-15 · 10:00
Cox Automotive EV Market Monitor: April 2026
2026-04-15 · 10:00
Cox Automotive EV Market Monitor: March 2026
2026-03-16 · 10:00
Cox Automotive EV Market Monitor: February 2026
January marked a reset for the EV market, with new‑vehicle demand softening sharply and inventory building, while used EV sales strengthened and supply tightened further. Pricing edged lower across both segments, narrowing EV‑to‑ICE premiums.
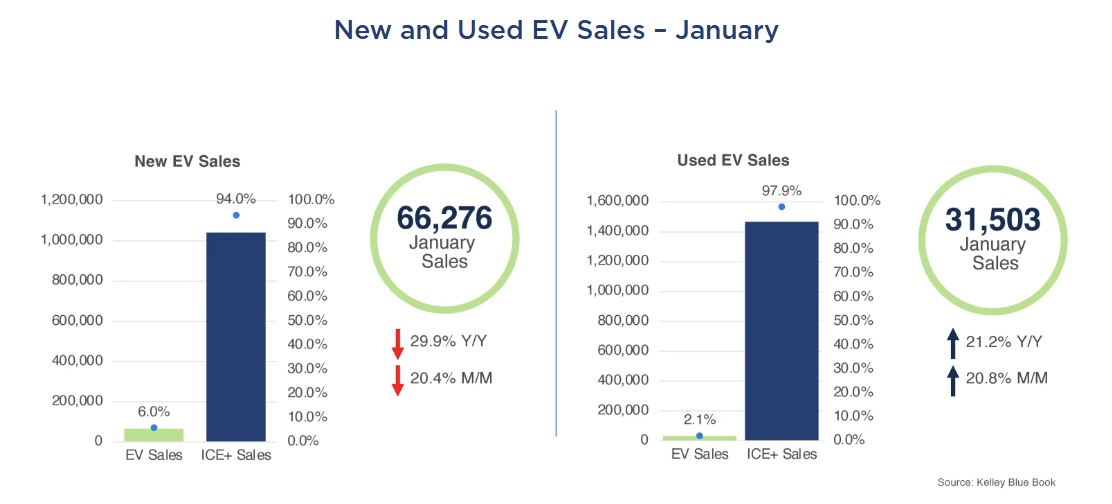
New EV Sales: January’s new EV sales totaled an estimated 66,276 units, down 29.9% from a year earlier and down 20.4% month over month. EV share of total new‑vehicle sales came in at 6.0%. The top five brands by unit volume were Tesla (40,100), Hyundai (3,074), Toyota (2,794), Cadillac (2,716), and Rivian (2,516). Tesla fell 17.0% month over month; however, its market share climbed to 60.5%, up from December’s 57.3%, as most competitors posted even steeper declines. Ford, which held the number‑two spot in December, saw volume drop 56.8% to 2,174 units and fell out of the top five, replaced by Toyota, which bucked the broader trend with a 34.5% gain. Nearly all brands recorded month-over-month losses, with Toyota, Lexus, Audi, and Subaru being the key exceptions.
Used EV Sales: In January, used EV sales reached 31,503 units, 21.2% higher than a year ago and up 20.8% from December. Market share rose to 2.1%. Tesla led the category with 12,416 units, followed by Audi (2,002), Ford (1,995), Chevrolet (1,959), and BMW (1,842). Most brands posted month‑over‑month increases, with Cadillac, Rivian, Porsche and GMC as the key exceptions – though most of those declines were modest, underscoring the broad‑based strength of the used EV market in January. Audi displaced Nissan from the top five, surging 63.4% month over month – the strongest gain among the leading brands.
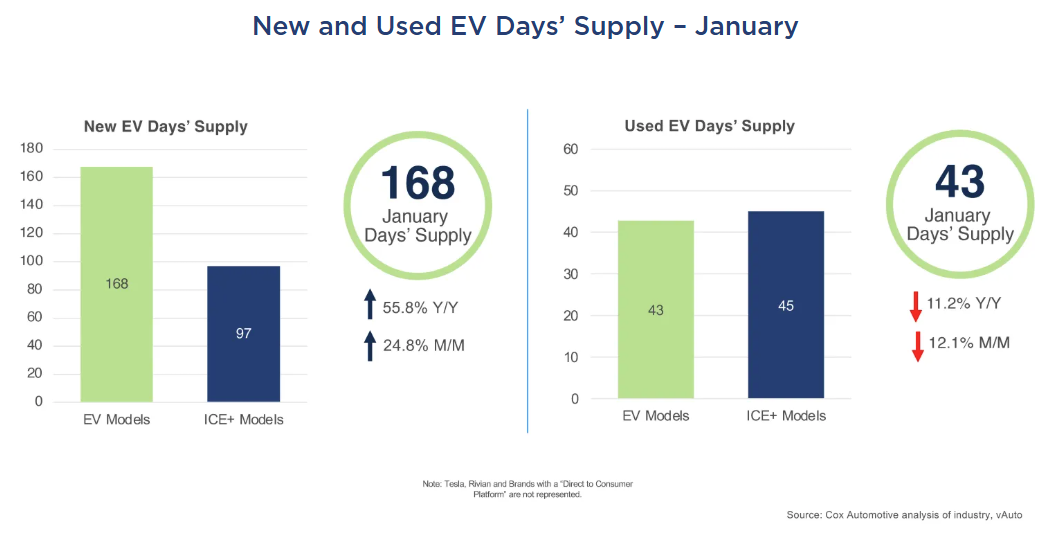
EV Days’ Supply: New EV days’ supply rose to 168 days in January, 55.8% higher than year‑earlier levels and up 24.8% month over month. The gap between EV and ICE+ days’ supply widened to 71 days, up from 59 days last month. At 168 days, new EV days’ supply is at its highest level since July 2024 and has nearly quadrupled from September’s near‑record low of 46 days. EV supply sat below ICE+ levels as recently as late October – that gap has since reversed by roughly 78 days.
Used EV Days’ Supply: Used EV days’ supply fell to 43 days in January, down 11.2% year over year and 12.1% lower month over month, remaining below ICE+ levels for the tenth consecutive month. Supply tightened across most brands, ranging from 35 days (Audi and Tesla, tied) to 62 days (Porsche). Audi saw the sharpest decline, dropping 23 days month over month as sales surged. Note: Tesla figures reflect only vehicles available through traditional dealerships, excluding vehicles at Tesla-owned outlets.
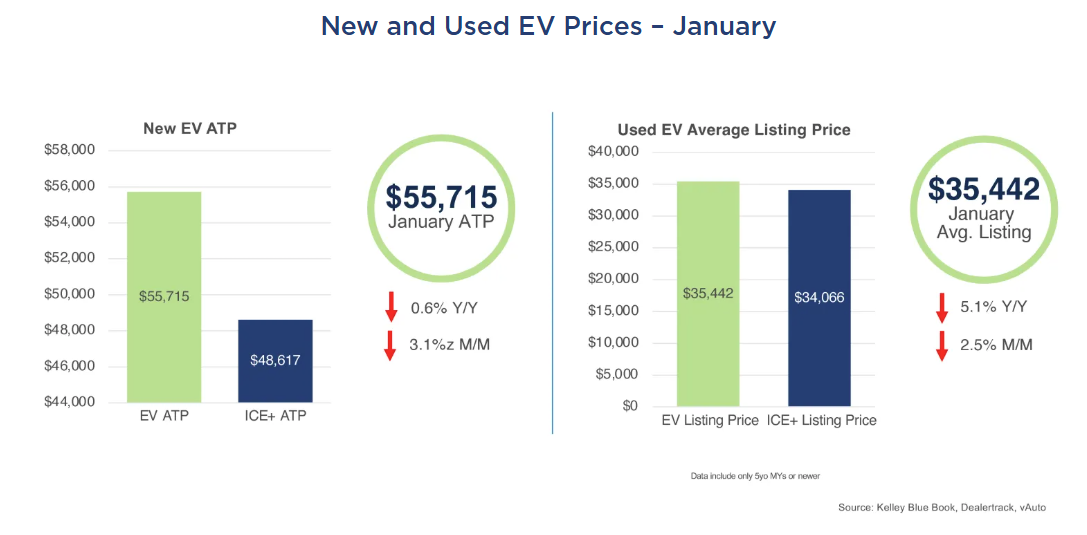
New EV ATP: The average transaction price (ATP) for new EVs in January was $55,715, down 0.6% year over year and 3.1% lower month over month. The EV premium over ICE+ narrowed to $7,098, the slimmest gap since July 2025. Incentives fell sharply from December’s record levels, averaging $6,918 or 12.4% of ATP, down from an upwardly revised 18.3% in December and below the 2025 full‑year average of 13.7%. Tesla saw its ATP decline 2.0% to $52,628, continuing to exert downward pressure on the overall EV average. Among other high‑volume brands, Mercedes-Benz (+7.9%) and Ford (+6.6%) recorded the largest month-over-month ATP increases, while Volvo (-23.5%) and Audi (-3.8%) posted the steepest declines.
Used EV Listing Price: The average listing price for used EVs was $35,442 in January, down 5.1% year over year and 2.5% month over month. The price premium over ICE+ vehicles narrowed further to $1,376, down from $2,591 in December, as used EVs continue to approach price parity with their ICE+ counterparts. Among high‑volume brands, Nissan (-3.2%), Kia (-2.8%), and Mercedes‑Benz (-2.3%) posted the steepest month‑over‑month declines. Audi bucked the trend, rising 4.8% to $39,502 even as sales surged 63.4%. Tesla edged up 0.6% to $31,760.
Looking Ahead
As the year progresses, the EV market is likely to remain uneven, with elevated new‑vehicle inventory and cautious consumer demand continuing to pressure volumes and pricing. Used EVs should remain a relative bright spot, supported by improving affordability and narrowing price gaps versus ICE+ vehicles. Near‑term momentum will hinge on disciplined production, more targeted incentive strategies, and the ability of more affordable EV models to sustain consumer interest without reigniting excess inventory.
In December, the electric vehicle (EV) market ended the year an up note, with sales rising for both new and used models. New EV supply remained elevated, and used EV days’ supply increased, though still below ICE levels. Pricing held largely flat across both segments, with heavy new‑vehicle incentives in place to counter softer retail momentum and used EV prices showing continued stability.
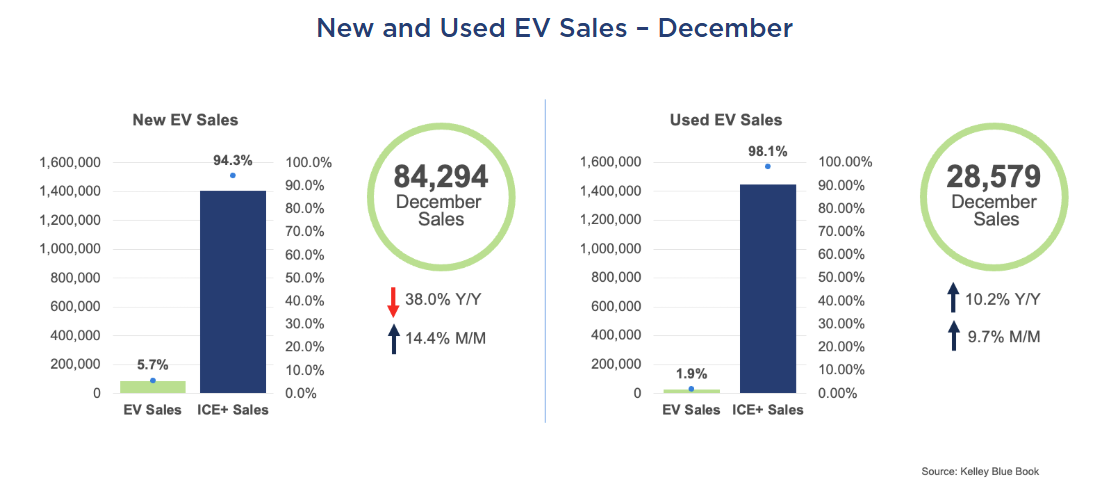
New EV Sales: December new‑EV sales totaled an estimated 84,294 units, down 38% from a year earlier but up 14.4% from November. EV share of total new‑vehicle sales held steady at 5.7%. The top five brands by unit volume were Tesla (48,300), Ford (5,052), Cadillac (3,919), Rivian (3,606) and Hyundai (3,135). Tesla grew 6.1% month over month; however, its market share eased to 57.3%, down from November’s elevated 61.8%, as several competitors bounced back more sharply from the post-tax credit slowdown. Most brands recorded month‑over‑month gains, with Genesis, Chevrolet and Audi being the key exceptions. Lucid stood out as the only major brand to reach its highest monthly volume of the year, delivering 2,415 units in December – a 146% increase from November.
Used EV Sales: In December, used EV sales reached 28,579 units, 10.2% higher than a year ago and up 9.7% from November. Market share held steady at 1.9%. For the full year 2025, used EV sales totaled 378,140 units, up 35.1% year over year and capturing 2.1% of the used‑vehicle market. In December, Tesla led the category with 10,837 units, followed by Ford at 1,915, Chevrolet at 1,904, BMW at 1,749, and Nissan at 1,429. Most brands posted month‑over‑month increases, with Ford down 2.7% and Audi down 19.3% as the key exceptions. Tesla’s dominance extended to the model level, taking four of the top five used EV positions, with the Mustang Mach‑E ranking third behind the Model 3 and Model Y. Among the top five brands, BMW delivered the strongest month‑over‑month growth, rising 18.6%.
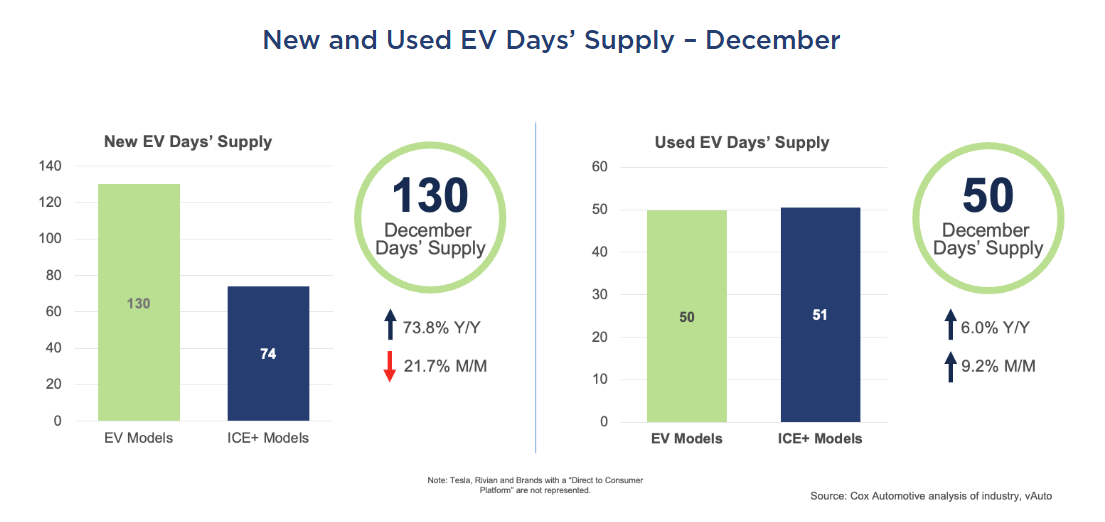
EV Days’ Supply: At the start of January, new EV days’ supply was at 130 days, up 73% from year-earlier levels, a significant gain. EV days’ supply, however, did decline through the month of December and is now lower by 22% month over month. The gap between EV and ICE+ days’ supply also declined over the past month, falling to 56 days. EV inventory has been elevated for more than two months now, following September’s near-record low of 46 days.
Used EV Days’ Supply: Used EV days’ supply reached 50 days in December, up 6% year over year and 9.2% month over month, remaining below ICE+ levels for the ninth consecutive month. Supply varied widely by brand, ranging from 35 days (Cadillac) to 67 days (Ford), while Tesla held 41 days of supply. Note: Tesla figures reflect only vehicles available through traditional dealerships, excluding vehicles at Tesla-owned outlets.
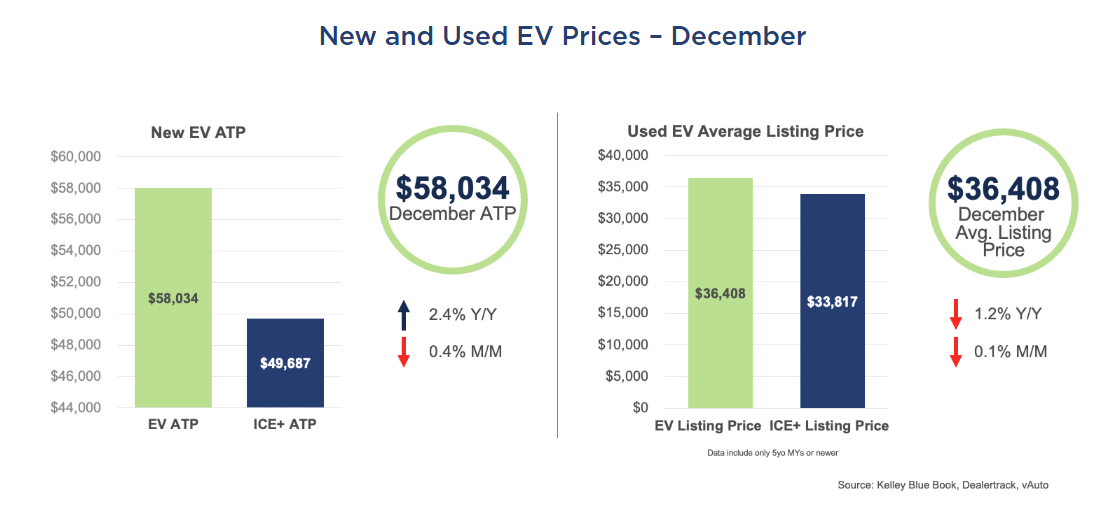
New EV ATP: The average transaction price (ATP) for new EVs in December was $58,034, up 2.4% year over year but down 0.4% month over month. Incentives climbed sharply to a year‑high of $10,473, or 18% of ATP, up 5 percentage points from November and reaching record territory. The price premium over ICE+ vehicles narrowed to $8,347, driven by elevated discounting. Tesla’s below‑segment pricing and large volume continue to exert downward pressure on the overall EV ATP, especially as incentives on Tesla models rose sharply in December.
Used EV Listing Price: The average listing price for used EVs was $36,408 in December, down 1.2% year over year and flat month over month, narrowing the price premium over ICE+ vehicles to $2,591. Tesla’s stable pricing helped anchor the market. Most brands posted month-over-month declines, though two brands saw notable increases, with Cadillac up 8.6% and Volvo up 4.2%. Affordability remained steady, with 39% of models selling below $25,000; the Nissan Leaf remained one of the most accessible options at $11,746.
Looking Ahead
As 2026 begins, the EV market is poised for another challenging year, with elevated inventory, pricing pressures and a post-incentive landscape continuing to test demand. Even so, the successful rollout of new EV models offers a meaningful counterbalance. Fresh entries across key segments can help revive consumer interest, provided automakers maintain discipline in production, deploy targeted incentives, and clearly communicate the value of newer, more efficient EV offerings.
In November, the electric vehicle (EV) market’s downturn deepened, with the expiration of the federal tax credit continuing to weigh on demand. Market share reached multi-year lows as sales declined. Weak demand fueled a surge in inventory, with days’ supply reaching elevated levels. Pricing eased across the market, underscoring an industry struggling to find balance in the post-incentive era.
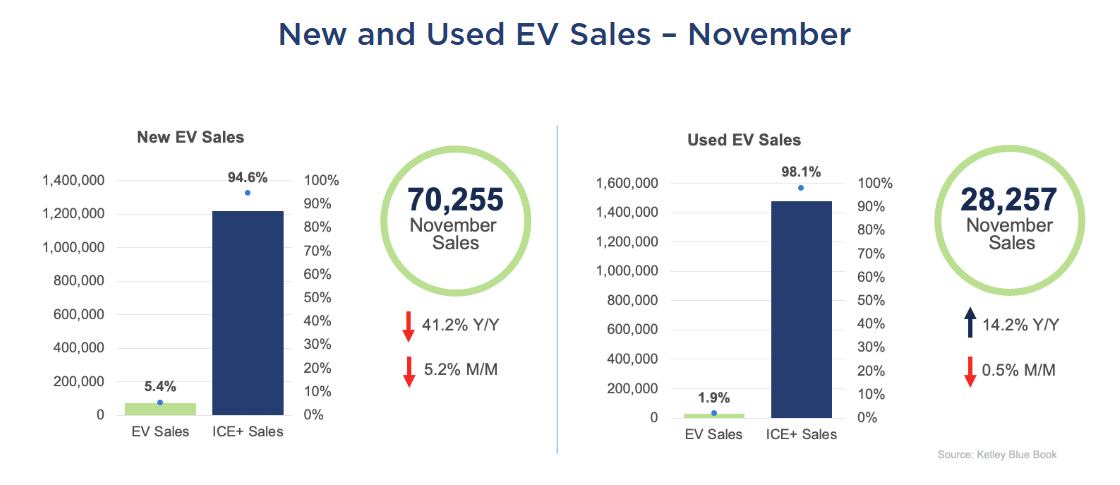
New EV Sales: Estimated November new EV sales totaled 70,255 units, down 41.2% from a year earlier and declining 5.2% from October. Despite November’s weakness, year-to-date EV sales remain 2.1% above last year’s pace. EV share of total sales fell to 5.4% in November, the lowest since April 2022 and down from October’s 5.8%. By volume, the market leaders were Tesla (39,800), Rivian (4,500), Ford (4,188), Chevrolet (3,112), and Hyundai (2,853). Tesla dropped 2.1% month over month but gained 2.2 percentage points of market share to reach 56.7%, as competitors faced even steeper declines. Several brands posted year-over-year sales volume gains, with Rivian leading at 7.6% and showing the strongest momentum. Rivian’s sales volume was up 14.1% from October.
Used EV Sales: In November, used EV sales reached 28,257 units, up 14.2% year over year but down 0.5% from October. Used EV market share held steady at 1.9%. Tesla led the segment with 10,785 units sold, followed by Ford with 2,094, Audi with 1,848, Chevrolet with 1,790, and BMW with 1,596. Tesla’s dominance extends to the model level, claiming four of the top five spots. Among the top five brands, Audi posted the strongest month-over-month performance with a 12.1% gain.
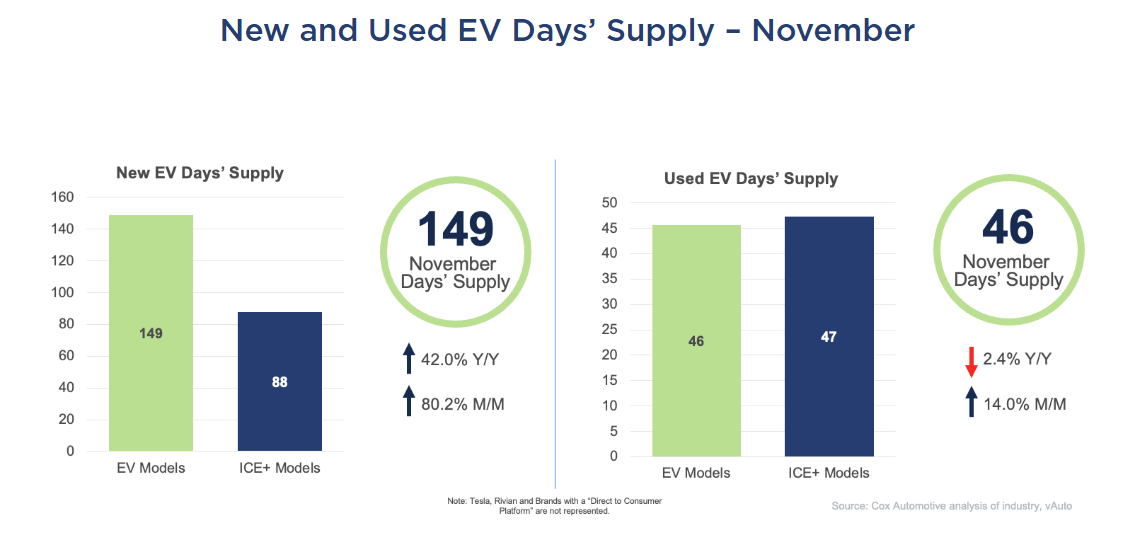
EV Days’ Supply: In November, new EV days’ supply soared to 149 days – up 42.0% year over year and 80.2% month over month – marking the highest inventory level since February 2024. This inventory level represents a dramatic reversal from September’s near-record low of 46 days. Toyota, Volkswagen and Hyundai were brands with the highest days’ supply in the latest measure, while BMW had the leanest inventory.
Used EV Days’ Supply: In November, used EV days’ supply was 46 days, down 2.4% year over year but up 14% from October, remaining below ICE+ levels for the eighth consecutive month. Supply varied widely by brand, ranging from Tesla’s tightest inventory at 37 days to Volkswagen’s 56 days among major brands. Note: Tesla figures reflect only vehicles available through traditional dealerships, excluding direct-to-consumer models.
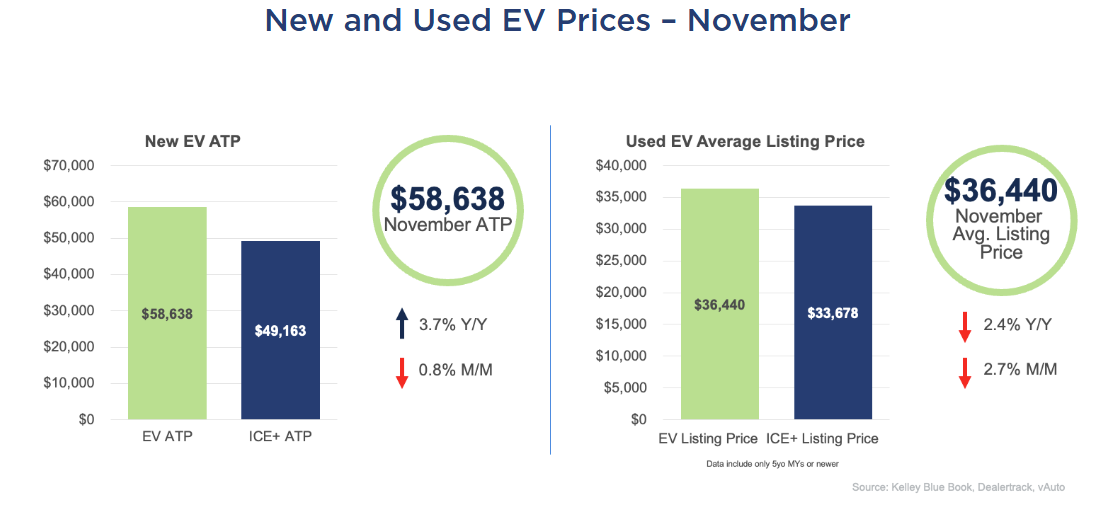
New EV ATP: In November, the average transaction price (ATP) for new electric vehicles was $58,638, up 3.7% year over year but down 0.8% from October. Incentives rebounded to $7,785, or 13.3% of ATP, up from October’s year-low of 11.1%, while the price premium over ICE+ vehicles narrowed to $9,475. Tesla’s ATP rose 1.5% month over month to $54,310, but with its dominant market share and below-market pricing, it continued to push the overall segment average downward.
Used EV Listing Price: In November, the average listing price for used EVs fell 2.4% year over year and 2.7% month over month to $36,440, narrowing the price premium over ICE+ vehicles to $2,762. Most brands posted month-over-month declines, with only Volvo, up 3.5%, and Kia, up 2.7%, showing notable increases. The average listing prices for a used Tesla slipped 1.8% to $31,515, a modest drop that heavily influenced the segment average given its dominant share. Forty-three models remained under $30,000, including the Tesla Model 3 at $23,583, the highest-volume used EV on the market.
Looking Ahead
As we head into 2026, the EV market will continue navigating post-incentive challenges, with inventory and pricing dynamics shaping near-term performance. Sustained recovery will depend on aligning production with demand, strategically leveraging incentives, and rebuilding consumer confidence to support long-term growth.
October marked a sharp reversal for the electric vehicle (EV) market as the expiration of the federal EV tax credit cooled demand after three months of accelerated sales. Buyers rushed to secure incentives before the deadline, but once it passed, momentum slowed. Inventories climbed quickly, and pricing shifted upward for both new and used EVs, reflecting a market in transition.
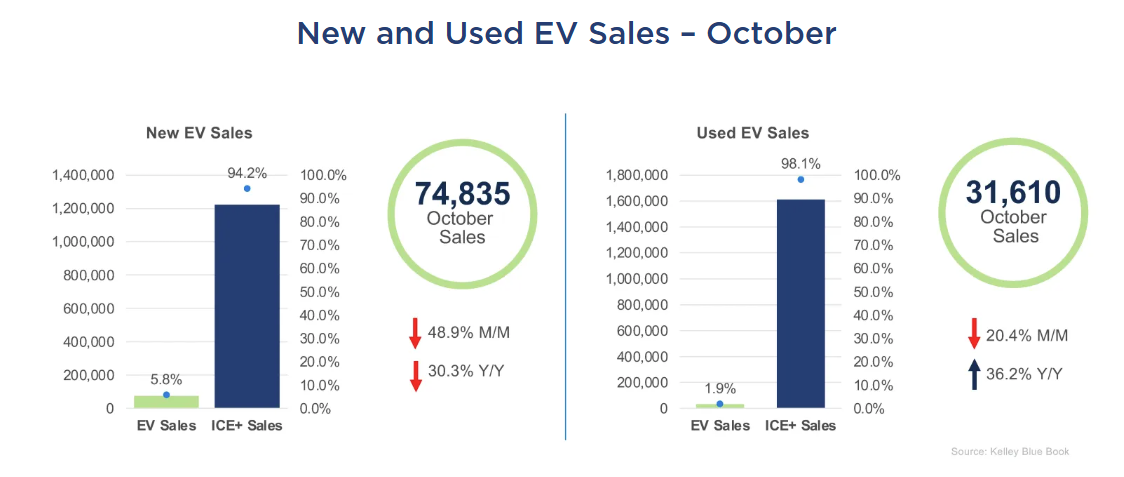
New EV Sales: Estimated October new EV sales totaled 74,835 units, plummeting 48.9% from September’s record high and down 30.3% from a year earlier. EV share of total sales dropped sharply to 5.8%, falling nearly 6 percentage points from September’s record of 11.6%. The decline was broad-based, with luxury down 39% and non-luxury down 65%. The top five market leaders by unit volume were Tesla (40,650), Chevrolet (5,910), Ford (4,912), Cadillac (4,344), and Hyundai (2,429). Tesla dropped 35.3% month over month but gained 2.2 percentage points of market share to reach 54.3%, as competitors faced even steeper declines. Rivian demonstrated relative resilience with the smallest decline among major manufacturers at just 14.7%.
Used EV Sales: In October, used EV sales reached 31,610 units, representing a 20.4% decline from September but still showing strong growth at 36.2% year over year. Market share fell to 1.9%, down 1 percentage point compared to the previous month. Tesla led the segment with 11,927 units sold, followed by Ford with 2,273, Chevrolet with 1,919, Audi with 1,754, and BMW with 1,708.
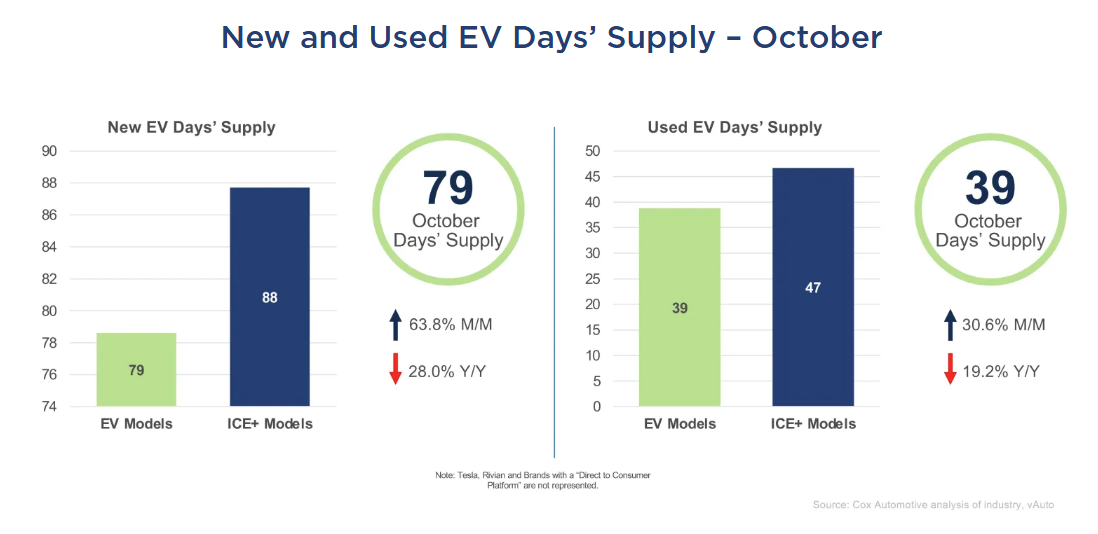
New EV Days’ Supply: In October, EV days’ supply rose sharply to 79 days – up 63.8% month over month and down 28% year over year – as sales momentum cooled and manufacturers continued adjusting production levels. This marks a significant reversal from September’s three-year low of 48 days. GMC maintained the highest days’ supply at 91 days, followed by Cadillac at 89 days and Ford at 71 days. On the opposite end, Subaru had the leanest inventory at just 8 days, while Toyota posted the largest month-over-month increase of 33 days, ending the month at 43 days of supply.
Used EV Days’ Supply: In October, used EV days’ supply rose to 39 days, up 30.6% from September’s 30-day low, though still below ICE+ levels for the eighth time this year. Supply varied widely by brand: Tesla had the tightest supply at 29 days’ supply, while Genesis led with 56, and GMC and Honda both had 55 days’ supply. Volkswagen posted the sharpest month-over-month gain, climbing 19 days’ supply to reach 40. Despite October’s improvement, overall supply was still 19.2% lower than a year ago, underscoring persistent inventory constraints in the used EV market. Note: Tesla figures reflect only vehicles available through traditional dealerships, excluding direct-to-consumer models.
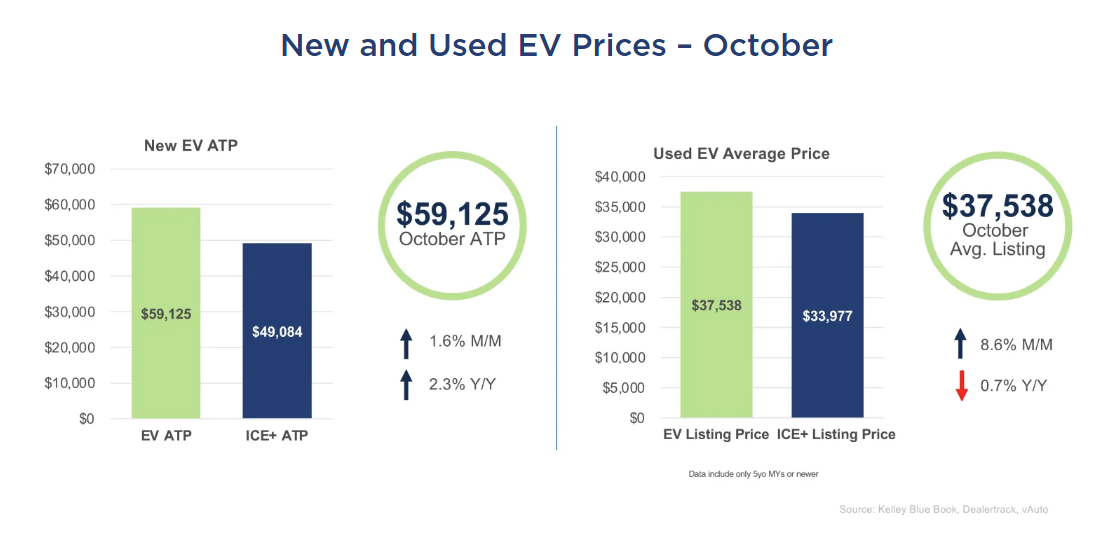
New EV ATP: In October, the average transaction price (ATP) for new electric vehicles climbed to $59,125, up 1.6% from September and 2.3% year over year. The price premium over internal combustion engine (ICE+) vehicles widened to $9,359, while incentives dropped to their lowest level of the year at 11.1% of ATP, or roughly $6,546. Porsche led all brands in month-over-month ATP gains with a dramatic 29.5% increase to $145,761, driven by the Taycan’s 35% jump and the Macan’s 1.3% rise. Higher-volume brands that led price increases included Chevrolet, up 5.4%, and Cadillac, up 5.1%. Tesla’s ATP declined 1.1% to $53,526, as its dominant sales volume continued to anchor the lower end of the EV price spectrum even as the overall market shifted upward.
Used EV Listing Price: The average listing price of used EVs surged 8.6% month over month in October to $37,538, though prices still sit 0.7% below year-ago levels. The October spike opened a $3,561 gap between EVs and ICE+ models, reversing September’s near parity between the segments. Thirteen makes posted price increases, led by Audi (12.2%), Tesla (9.5%), Subaru (9.5%), Chevrolet (7.8%), and Kia (4.8%). Despite the broad-based increases, 42 models remained priced under $30,000, with the Leaf remaining one of the most affordable at $12,166.
Looking Ahead
October’s sharp reversal marks the beginning of a necessary adjustment period as the EV market adapts to post-incentive realities. This correction will separate manufacturers with genuine cost advantages from those dependent on subsidies. Success will hinge on production discipline, pricing realism, and focus on the fundamentals: cost, confidence and convenience. The market isn’t retreating; it’s recalibrating to its natural pace.
September marked a third consecutive strong month for the electric vehicle (EV) market, helping push Q3 sales to a record high. As buyers rushed to take advantage of the final days of the federal EV tax credit, demand remained elevated, inventory tightened sharply, and incentives continued to shape sales across both new and used segments.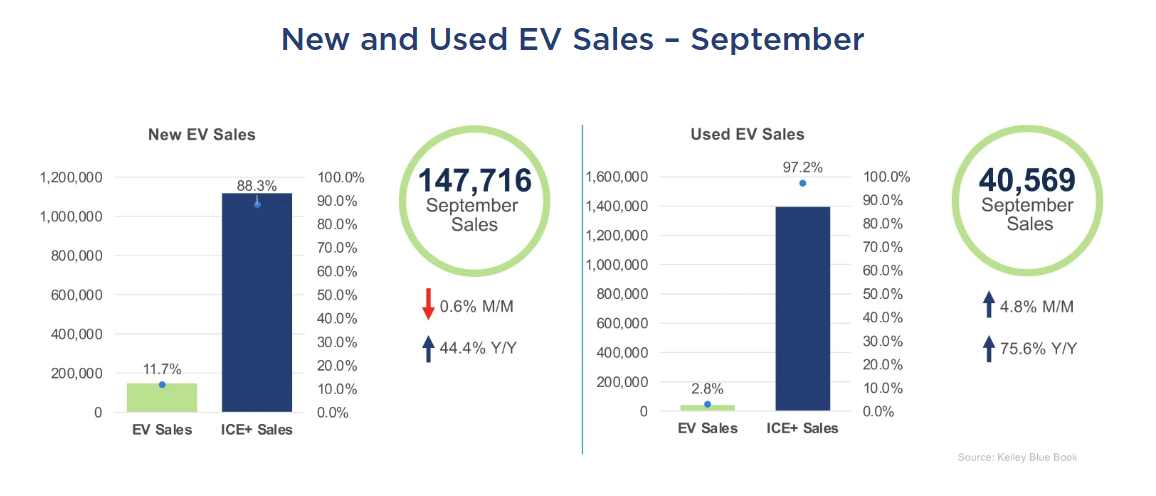
New EV Sales: Estimated September new EV sales totaled 147,716 units, down slightly – 0.6% from August – but up 44.4% from a year earlier. EV share of total sales in September reached a record of 11.7%. Several brands posted their highest monthly volumes of 2025, including Tesla, Ford, Hyundai, Cadillac, Kia, GMC, and Rivian. The top five market leaders by unit volume were Tesla (62,834), Chevrolet (11,402), Ford (11,057), Hyundai (10,556) and Cadillac (7,570). Estimates show Tesla sales grew 6.1% month over month, lifting its share of total EV sales to 42.5%, up 2.7 points. Among luxury brands, Cadillac posted the strongest growth, up 25.5% to 7,570 units, gaining 1.1 points of share. GMC also surged 48%, driven by strong demand for utility EVs, while Kia climbed 15.6%, reinforcing its position in the non-luxury segment.
Used EV Sales: Used EV sales reached 40,569 units in September, up 4.8% month over month and 75.6% year over year, pushing market share to a new high of 2.8%. The top five makes by unit volume were Tesla (16,494, up 2.1%), Chevrolet (3,541, down 2.3%), Ford (2,566, up 11.3%), Audi (2,135, up 26.0%) and Volkswagen (1,980, up 21.8%). While Tesla remained dominant, its share of the used EV market dipped to 40.7%, down 1 point from August. Audi and Volkswagen posted the largest share gains, up 0.9 and 0.7 points, respectively.
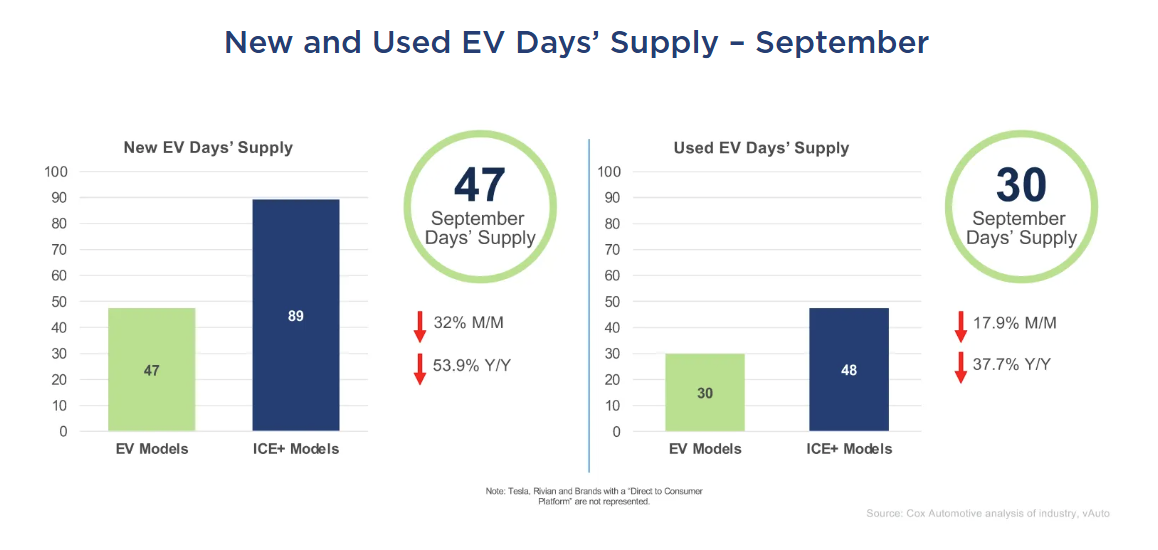
New EV Days’ Supply: In September, EV days’ supply fell to 47 days – the lowest level in three years – down 32% month over month and 53.9% year over year. EV supply now trails ICE+ inventory by 45 days – the widest gap on record since 2021. The average decline across all makes was 26 days, signaling broad tightening in EV availability. The brands with the largest declines were Porsche, down 65 days; Ford down 50 days; and Genesis, down 45 days. GMC had the highest EV supply at 123 days, while Toyota had the lowest at just 10 days.
The average decline across all makes was 26.2 days, signaling broad tightening in EV availability. The brands with the largest declines were Porsche, down 65 days; Ford down 50 days; and Genesis, down 45 days. GMC had the highest EV supply at 123 days, while Toyota had the lowest at just 10 days.
Used EV Days’ Supply: In September, used EV days’ supply dropped to 30 days, the lowest level since March 2022, and remained below ICE+ levels for the seventh time this year. Supply levels varied across makes. Tesla (22 days), Chevrolet (26) and Nissan (28) had the lowest availability, while Ford (53) and GMC (62) had the highest, hovering near or above a two-month supply. Toyota, down 18 days, and Volkswagen, down 16 days, posted the steepest month-over-month declines. Genesis, down 17 days, and Rivian, down 16 days, saw the largest drops in the luxury segment. Note: Tesla and Rivian figures reflect only vehicles available through traditional dealerships, excluding direct-to-consumer models.
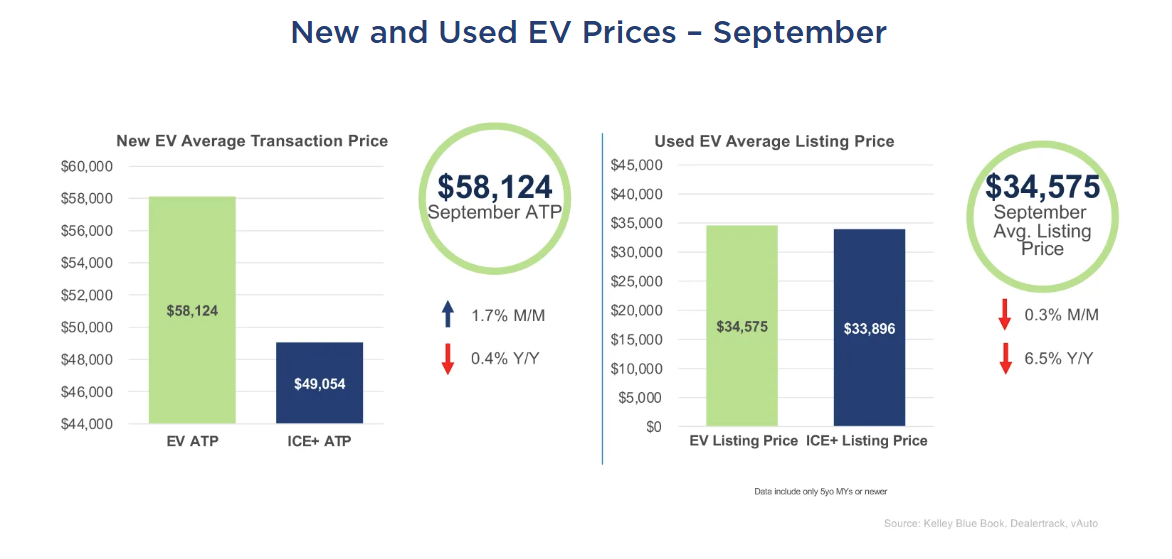
New EV ATP: In September, the average transaction price (ATP) for new electric vehicles rose to $58,124, up 1.7% from August and down 0.4% year over year. The price premium over internal combustion engine (ICE+) vehicles held steady at $9,070, while incentives eased to 15.3% of ATP, or roughly $8,890. Luxury EVs accounted for 62% of total EV volume, and the increased volume of full-size electric trucks and SUVs pushed higher-priced models into the mix. Toyota led all brands in month-over-month ATP gains with an 8.6% increase, followed by luxury brands Volvo, up 6.4%, and Audi, up 4.8%. While Tesla’s ATP slipped 0.6%, its dominant sales volume pulled down the overall average. Among the top five EVs by sales – Tesla Model Y, Model 3, Hyundai Ioniq 5, Ford Mustang Mach-E and Chevrolet Equinox EV – the Equinox EV had the lowest ATP, averaging just $40,096.
Used EV Listing Price: In September, the average listing price for used electric vehicles declined to $34,575, down 0.3% from August and 6.5% year over year. The price premium over used ICE+ vehicles narrowed further to just $679, continuing the trend toward price parity. Fourteen makes had a lower average EV price than their ICE+ counterparts, and 15 makes were priced below $30,000, with Nissan among the lowest at $20,000. The top-selling models – Tesla Model 3, Tesla Model Y, Ford Mustang Mach-E, Volkswagen ID.4, and Tesla Model S – were all listed under $30,000, with the ID.4 the lowest at $22,919.
Looking Ahead
With the federal EV tax credits now expired, the market enters a new phase driven by fundamentals. Continued electric vehicle adoption will hinge on how effectively the industry addresses cost, confidence and convenience. Affordability remains a key hurdle exacerbated by the lack of federal incentives. Battery health transparency is essential to building trust, and charging infrastructure will shape regional momentum. As used EV prices approach parity and consumer interest holds steady, long-term success will depend on delivering value and access – without relying on subsidies.
August marked a second consecutive strong month for the electric vehicle (EV) market, with record sales and rising market share in both the new and used segments. As consumers acted quickly ahead of the Inflation Reduction Act’s tax credit expiration, Cox Automotive saw demand stay strong, inventory tighten, and incentives remain influential. These shifts signal a market on the verge of a change as government-backed sales incentives dry up at the end of September.
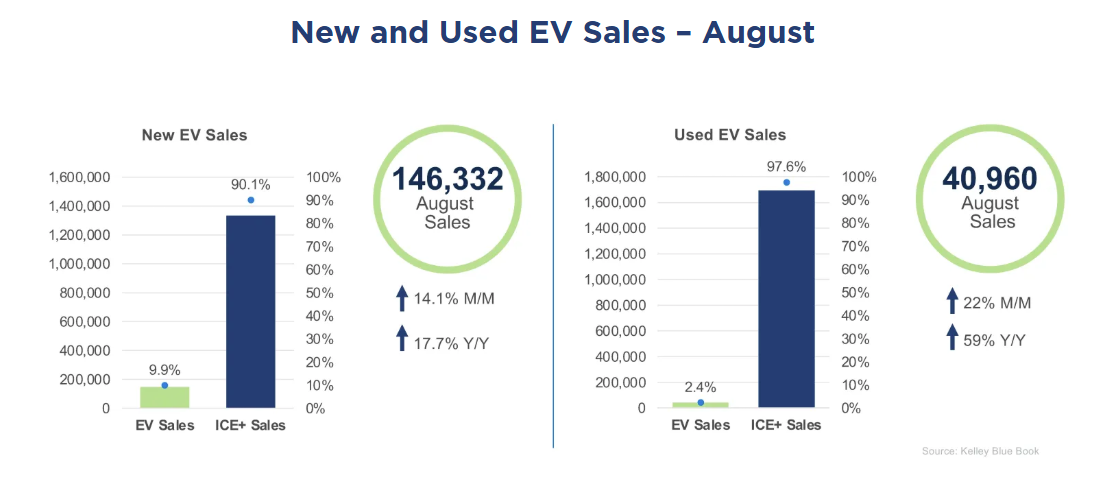
New EV Sales: August new EV sales climbed to a record 146,332 units, up 14.1% month over month and 17.7% year over year, lifting market share to an all-time high of 9.9%. Thirteen brands posted their best EV sales of the year. The top five by volume – Tesla (55,500 units), Chevrolet (12,191), Ford (10,414), Hyundai (10,186), and Honda (9,347) – continued to lead the market. While Tesla grew modestly (3.1%), its market share declined by 4 points to 37.9%. Honda, with only the Prologue in market, surged 47.9% month over month to reach 6.4% share. Among luxury brands, Audi posted the strongest growth, up 65.1% to 7,326 units, capturing 5% market share.
Used EV Sales: Used EV sales reached a record 40,960 units in August, up 22% month over month and 59% year over year, pushing market share to a new high of 2.4%. The top five makes by volume showed double-digit month-over-month growth: Tesla (17,164 units, 17.6%), Chevrolet (3,801 units, 17.3%), Ford (2,456 units, 39.6%), BMW (2,031 units, 38%) and Nissan (1,888 units, 21.6%). While Tesla remained dominant, its share of the used EV market dipped to 41.9%, down 1.6 percentage points from July. Ford and Volkswagen posted the largest share gains among major brands, each up 0.8 percentage points.
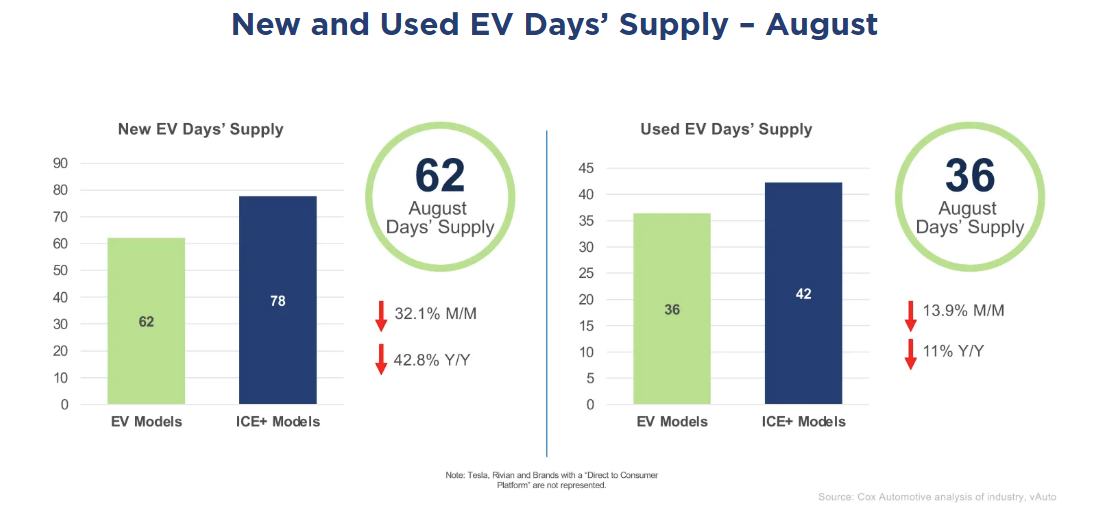
New EV Days’ Supply: In August, driven in part by strong sales, new EV days’ supply fell sharply to 62 days, down 32.1% month over month and 42.8% year over year, the lowest level recorded in 2025. Supply dropped 71 days from the June peak of 133 days. Most brands saw notable declines. GMC had the highest days’ supply at 139, while Toyota had the lowest at just 14 days. Audi posted the largest drop, falling 104 days to end the month at 67 days.
Used EV Days’ Supply: In August 2025, the days’ supply of used electric vehicles fell to 36 days, the lowest level of the year, and remained below ICE+ levels for the sixth time this year. As with the new EV market, supply levels vary significantly by make. Tesla had the lowest days’ supply at 26 days, with Chevrolet (32 days) and Nissan (32 days) also showing low levels. In contrast, Rivian (65 days), Ford (62 days) and GMC (58 days) had the highest levels, each hovering around a two-month supply. (Note: Tesla and Rivian days’ supply measures reflect only vehicles available through traditional dealerships, NOT models offered directly by the company.)
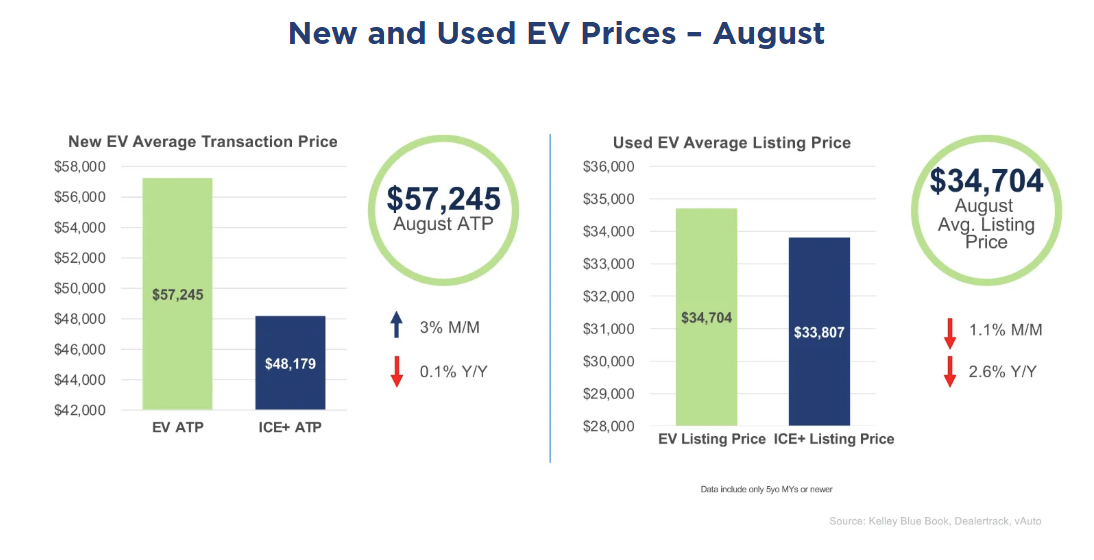
New EV ATP: In August, the average transaction price (ATP) for new electric vehicles rose to $57,245, up 3% from July and down by 0.1% year over year. The price premium over ICE+ vehicles increased to $9,066, reversing a three-month decline. EV incentives dipped to 16% of ATP, though this remained the second-highest level of the year. Among brands, Mercedes-Benz posted one of the largest ATP increases at 11.1%, followed by Nissan at 7.1%. While Tesla’s ATP rose 2.9%, its dominant sales volume played a key role in lifting the overall average. Of the top six selling EVs – Tesla Model Y, Tesla Model 3, Honda Prologue, Chevrolet Equinox EV, Hyundai Ioniq 5 and the Mustang Mach-E – nearly all saw strong incentives play a role in driving higher volume. Hyundai Ioniq 5 and Honda Prologue had the most aggressive incentives, while the Chevrolet Equinox EV had the lowest ATP among the group and very little incentive support, underscoring its price-driven appeal and competitive market positioning.
Used EV Listing Price: In August, the average listing price for used electric vehicles declined to $34,704, down 1.1% from July and 2.6% year over year. The price premium over used ICE+ vehicles narrowed to just $897, the lowest gap on record. Importantly, 14 makes had a lower average EV price than their ICE+ counterparts, highlighting the growing affordability and accessibility of used EVs. The top-selling models – Tesla Model 3, Tesla Model Y, Chevrolet Bolt EV, Tesla Model S and Ford Mustang Mach-E – were all priced below the market average, reinforcing their appeal to budget-conscious buyers. The Model 3, which led in volume, averaged $23,278, while the Chevrolet Bolt EV remained one of the most affordable options at $14,705. The Nissan Leaf, another high-volume model, was priced even lower at $12,890, further emphasizing the value proposition of used EVs.
The electric vehicle (EV) market gained strong momentum in July, with new and used EV sales rising sharply as consumers accelerated purchases ahead of the Inflation Reduction Act’s tax credit expiration. Inventory tightened, incentives climbed, and pricing adjusted – highlighting a market still heavily influenced by policy support but increasingly responsive to real-time demand.
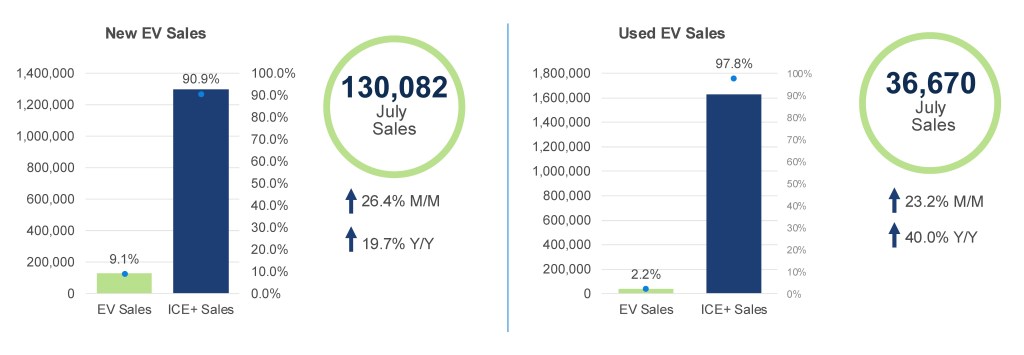
New EV Sales: July new EV sales climbed to 130,082 units, up 26.4% month over month and 19.7% year over year, lifting market share to 9.1%. It was the second-highest monthly total on record, with 11 brands posting their best EV sales of the year. The top five by volume – Tesla (53,816 units), Chevrolet, Hyundai, Ford and Honda – all saw strong gains, while Volkswagen surged 454% to sixth place. Luxury brands also performed well, with Audi (+150.2%), Cadillac (+14.5%) and Mercedes-Benz (+6.4%) signaling continued strength in the premium segment.
Used EV Sales: Used EV sales rose to 36,670 units in July, up 23.2% month over month and 40.0% year over year, holding a 2.2% share of the overall used-vehicle market. The top five makes by volume were Tesla (15,903 units, +18.0%), Chevrolet (3,499 units, +28.6%), Ford (1,967 units, +25.7%), Mercedes-Benz (1,724 units, -12.3%) and Nissan (1,659 units, +19.9%). Tesla remained the clear leader, though its share dipped to 43.4%, down from 45.2% in June. Among luxury brands, BMW and Audi posted strong gains, up 43.8% and 38.0%, respectively. The largest month-over-month percentage increases came from Honda (+103.0%), Hyundai (+61.3%) and Rivian (+60.5%).
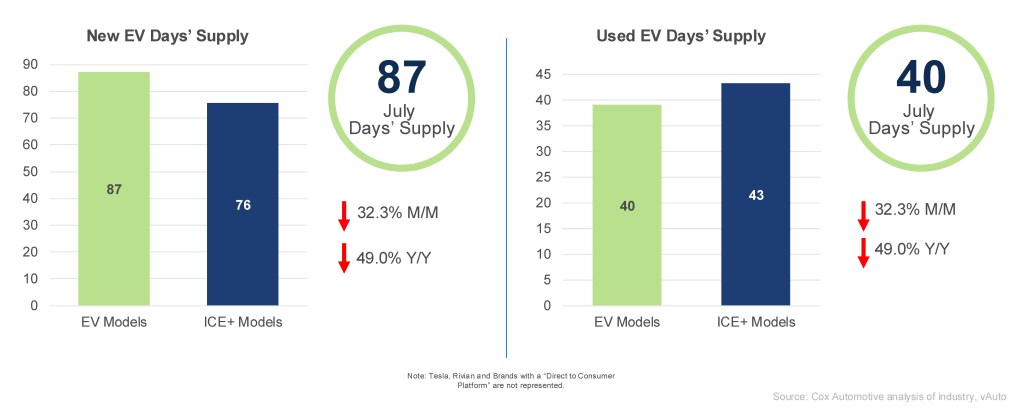
New EV Days’ Supply: In July, new EV days’ supply fell sharply to 87 days, down 32.3% month-over-month and 49.0% year over year. The gap between EVs and ICE+ vehicles narrowed by 75.9%, shrinking from 48.1 days in June to just 11.6 days in July – its smallest margin since February 2025. Supply levels varied by brand: Audi held the highest EV days’ supply at 168 days, despite a 115-day drop from June, while Toyota had the lowest at just 42 days after a 32-day decline. The steepest drop came from Volkswagen, which fell 153 days to 116.
Used EV Days’ Supply: The days’ supply of used electric vehicles declined to 40 days in July 2025, continuing a multi-month trend of tightening inventory and remaining below ICE+ vehicles for the fifth consecutive month. As with the new EV market, supply levels vary widely by make: Tesla had the lowest days’ supply at 29.4 days, followed closely by Chevrolet and Nissan, both under 40 days – highlighting strong demand and limited availability. In contrast, GMC, Ford and Rivian posted the highest supply levels, all above 64 days, suggesting slower turnover.
New and Used EV Prices – July
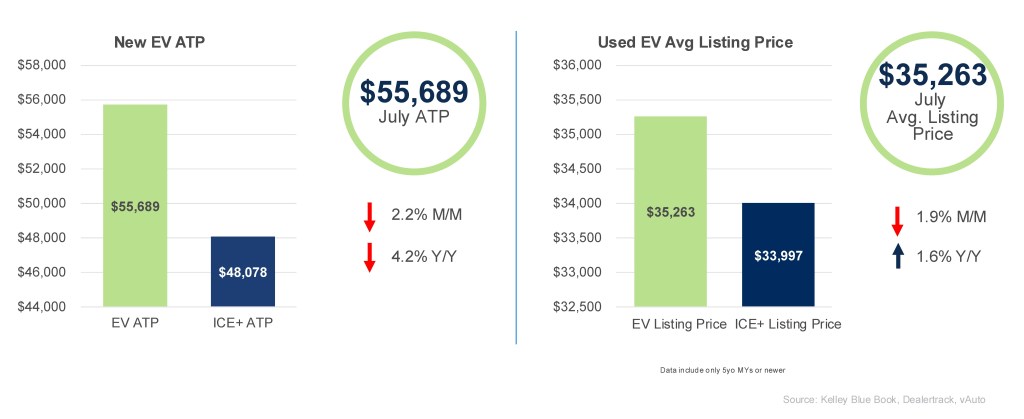
New EV ATP: In July, the average transaction price (ATP) for new electric vehicles declined to $55,689, reflecting a 2.2% decrease from June and a 4.2% decline year-over-year. The price gap with ICE+ vehicles narrowed to $7,611, the smallest since December 2024. EV incentives rose for the fourth consecutive month, reaching a record in the modern era of EV sales at 17.5% of ATP, or $9,768. Among brands, Volvo had the largest ATP decline at 17.1%, followed by Volkswagen at 12.2%, while Tesla dropped 2.4%, significantly influencing the overall average due to its volume. The top five selling EVs – Tesla Model Y, Tesla Model 3, Chevrolet Equinox EV, Honda Prologue and Hyundai Ioniq 5 – saw pricing and incentives play a pivotal role in driving volume. Incentives ranged from 14.5% to 27.7% of ATP, bringing effective prices for all five models below $40,000. The Chevrolet Equinox EV stood out with the lowest ATP at $38,477 and no reported incentives, reinforcing its strong value positioning.
Used EV Listing Price: The used electric vehicle market saw a price drop in June, with the average price declining to $35,263, down 1.9% from the previous month and up 1.6% year over year. The price gap between used EVs and ICE+ vehicles narrowed to a record low of just $1,266, signaling increased affordability and competitiveness. Tesla models continue to lead the segment in pricing dynamics: the Model 3, Model Y and Model S are all priced well below the market average, with a weighted average of $26,294. The Chevrolet Bolt EV, at $14,408, remains one of the most accessible options for budget-conscious buyers, while the Tesla Model X, priced at $39,656, stands out as a premium offering.
With the IRA tax credit set to expire at the end of September, urgency is likely to remain high, positioning the EV market for continued strength through the remainder of Q3. July’s performance sets a strong precedent, and as policy support winds down, the market’s ability to respond to real-time demand and brand-level dynamics will be critical in shaping the next phase of growth.
The EV market in June showed signs of steady momentum, even as underlying dynamics continued to shift. New EV sales softened slightly, but market share climbed. Used EV sales dipped month over month but remained sharply higher than a year ago. Inventory levels, pricing and incentives all indicate a market adjusting to evolving consumer demand and the waning influence of policy-driven support.
New and Used EV Sales – June
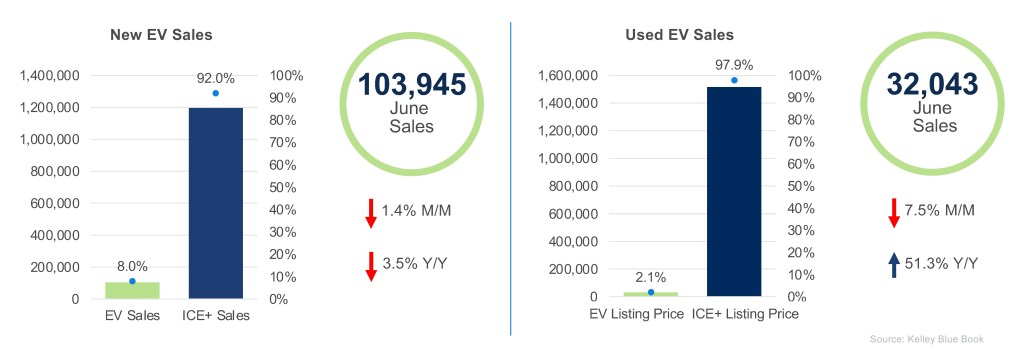
New EV Sales: In June, new EV sales totaled 103,945 units, marking a modest 1.4% decline from May. Despite the dip in volume, market share rose to 8%, up from 6.9% the previous month. On a year-over-year basis, sales declined 3.5%, a smaller decline than the overall market and an indication of the general market slowing. At the brand level, the top five performers were Tesla, Chevrolet, Hyundai, Ford and Cadillac. Market leader Tesla saw a 2.9% month-over-month increase, while Chevrolet posted a robust 24.4% gain, helping General Motors maintain its position as the second-leading EV manufacturer. Kia also staged a notable comeback, with sales surging 48.2% to 2,094 units, signaling renewed momentum for the brand.
Used EV Sales: The used EV market declined 7.5% month over month in June to 32,043 units, holding a 2.1% share of the overall used-vehicle market. Still, year-over-year sales jumped 51.3%, signaling strong long-term momentum. Tesla remained dominant, though its share dipped to 45.2%, with the Model 3, Model Y and Model S ranking as the top three bestsellers. The Chevrolet Bolt EV edged out the Model X, placing fourth overall. Mercedes-Benz was one of the few major brands to post a monthly gain (5.4%), driven by a 38.6% rise in EQB sales. Audi and Porsche also saw growth, up 19.6% and 3.6%, respectively, highlighting strength in the luxury EV segment.
New and Used EV Days’ Supply – June
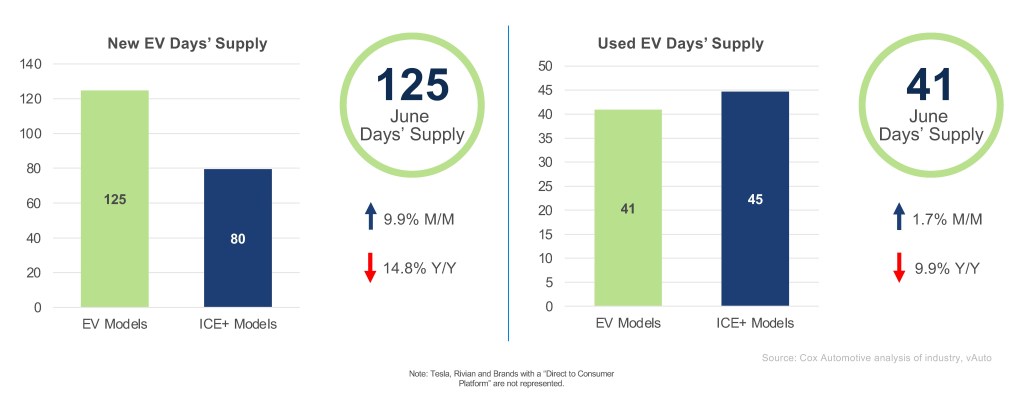
New EV Days’ Supply: In June, new EV days’ supply rose 9.9% month over month to 125, though it remains 14.8% lower than the same period last year. For the third consecutive month, EV inventory has outpaced ICE+ by more than 30 days — potentially benefiting consumers through greater availability and more competitive pricing, especially as the window for federal EV tax credits begins to close. Supply levels varied by brand: Audi, Volvo and Porsche posted the largest increases in EV days’ supply. Nissan remains the lowest for the second consecutive month.
Used EV Days’ Supply: The days’ supply of used electric vehicles increased by 1.7% in June, effectively rising by just one day to 41, still 9.9% below year-ago levels and indicative of continued tight inventory. For the third consecutive month, the gap between used EVs and ICE+ vehicles remained under five days. As with the new EV market, days’ supply for used EVs varies widely by make: Tesla remains among the lowest at 33 days, while GMC leads at 74 days.
New and Used EV Prices – June
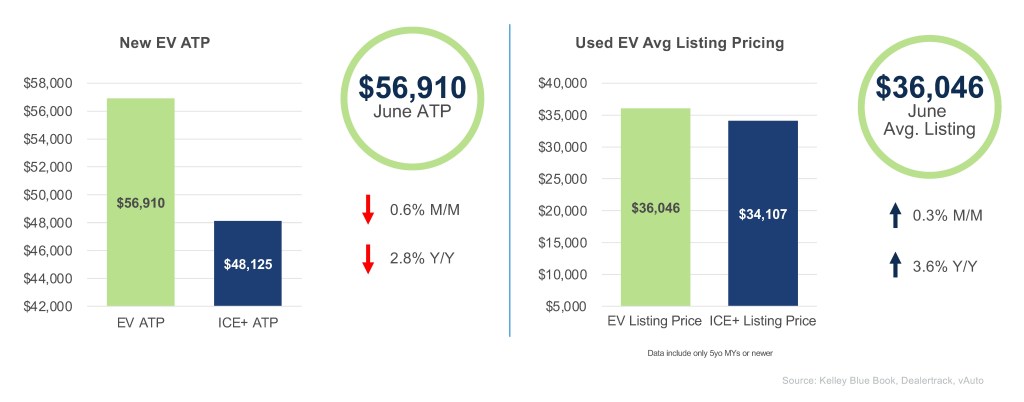
New EV ATP: In June, the average transaction price (ATP) for new electric vehicles dipped slightly to $56,910, reflecting a 0.6% decrease from May and a 2.8% decline year over year. The price gap between EVs and ICE+ vehicles narrowed to $8,785, down from $9,260 the previous month. EV incentives rose for the third consecutive month, reaching a record 14.8% of ATP, or $8,451 – more than twice the incentive level offered on ICE+ vehicles. This underscores the continued push to make EVs more accessible amid softening demand. Seven EV models had average transaction prices below $40,000, with the Nissan Leaf remaining the most affordable at $32,047. The Chevrolet Equinox, priced at $39,731, led in sales volume, making it the top-selling EV in this price range.
Used EV Listing Price: The used electric vehicle market saw a modest price increase in June, with the average listing price rising to $36,046, up 0.3% from the previous month and 3.6% year over year. The price gap between used EVs and ICE+ vehicles remained narrow, below $2,000.Importantly, 43% of used EVs sold were priced under $25,000, highlighting the growing affordability in this segment. The Tesla Model 3 and Model Y, the top-selling used EVs, both fell within this range, averaging $22,998 and $29,111, respectively.