China CPI
Data
Prices
- Source
- National Bureau of Statistics China
- Source Link
- https://www.stats.gov.cn/
- Frequency
- Monthly
- Next Release(s)
- October 14th, 2025 8:30 PM
Latest Updates
-
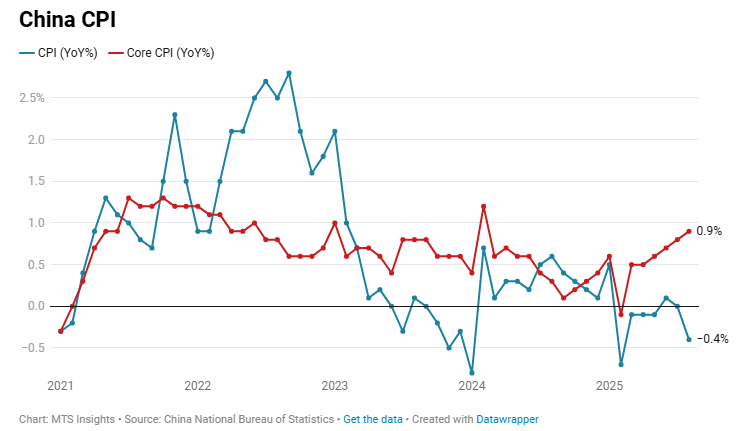
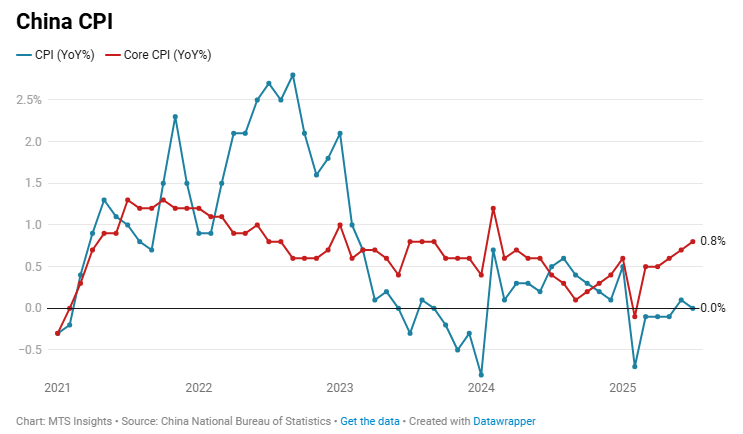
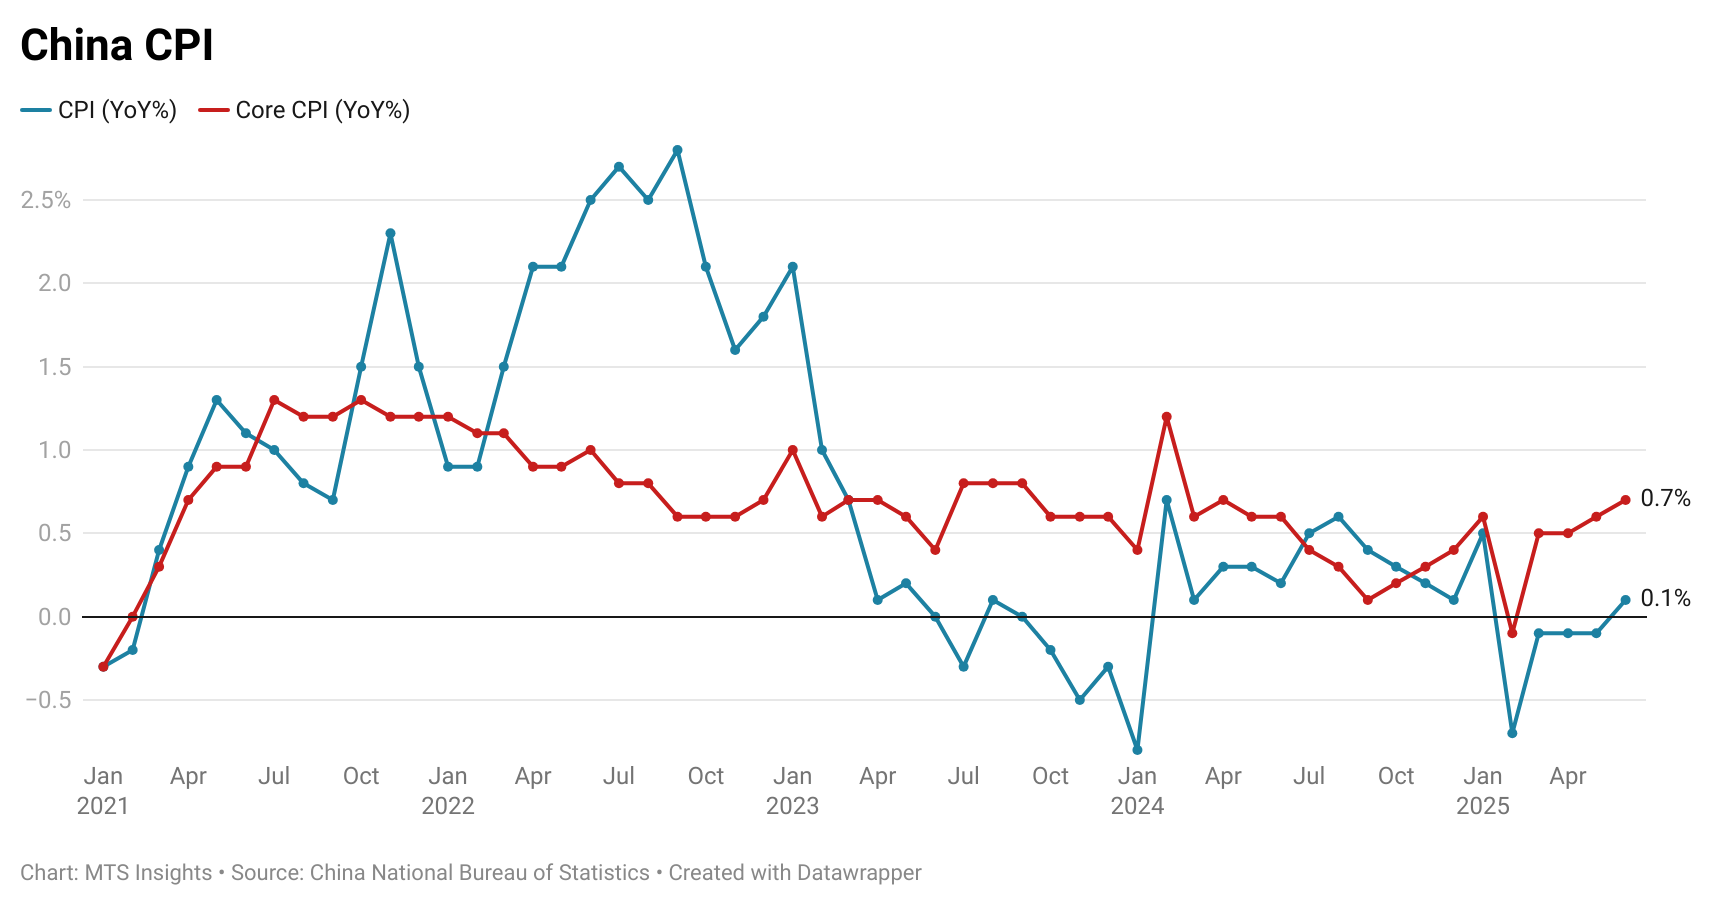
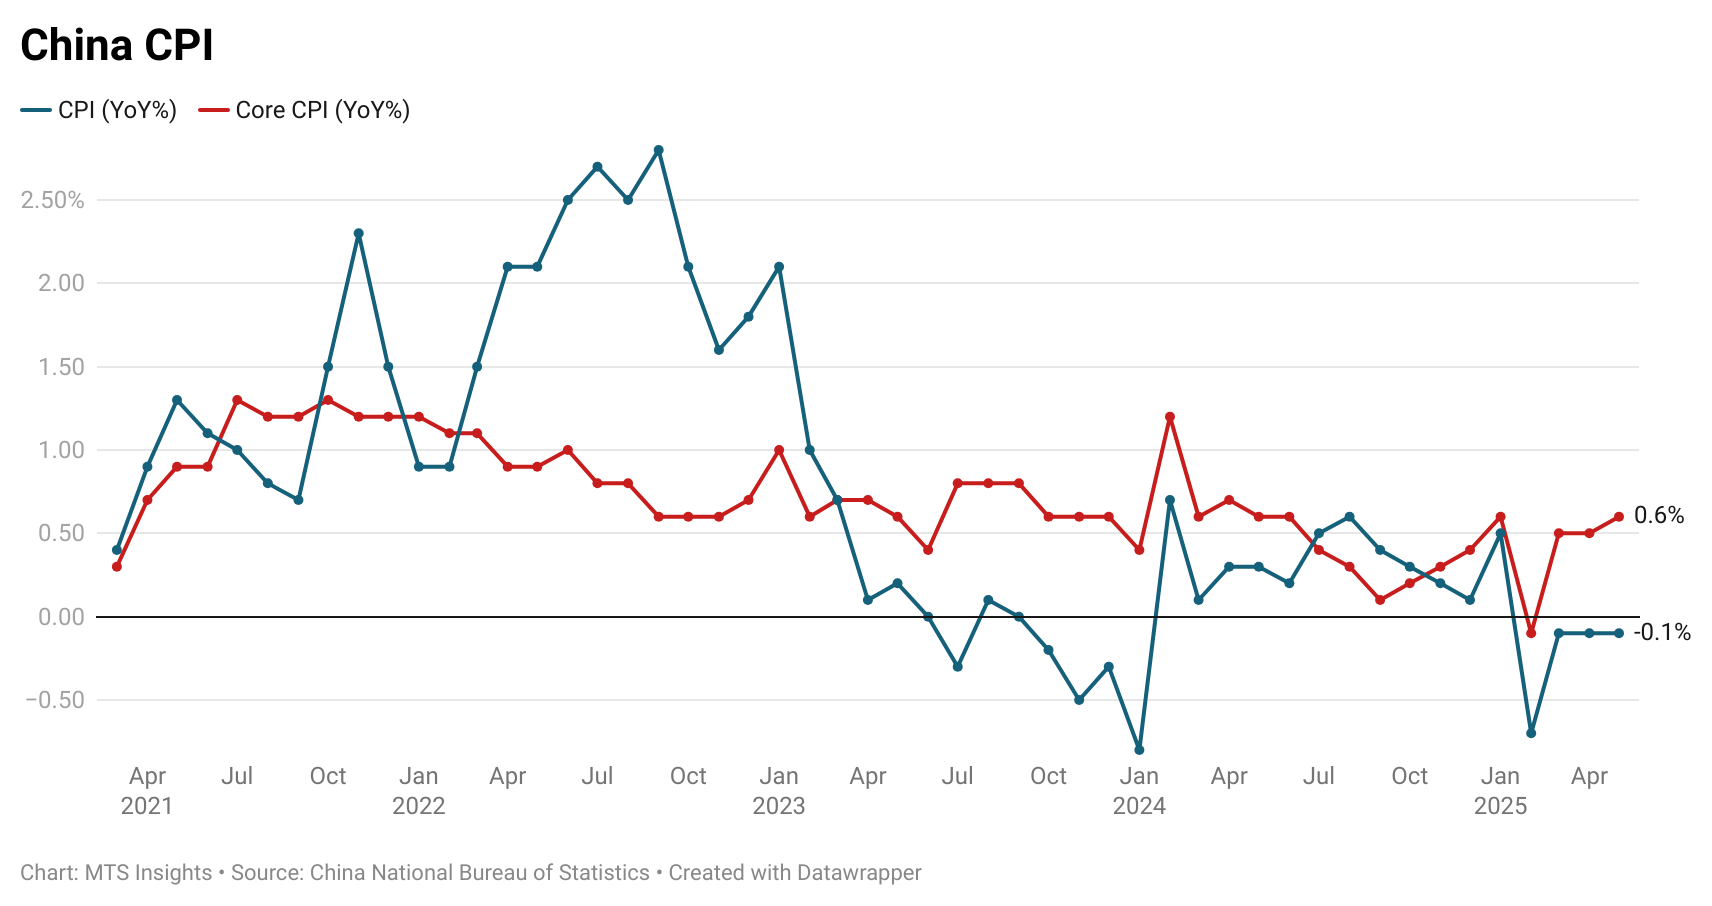
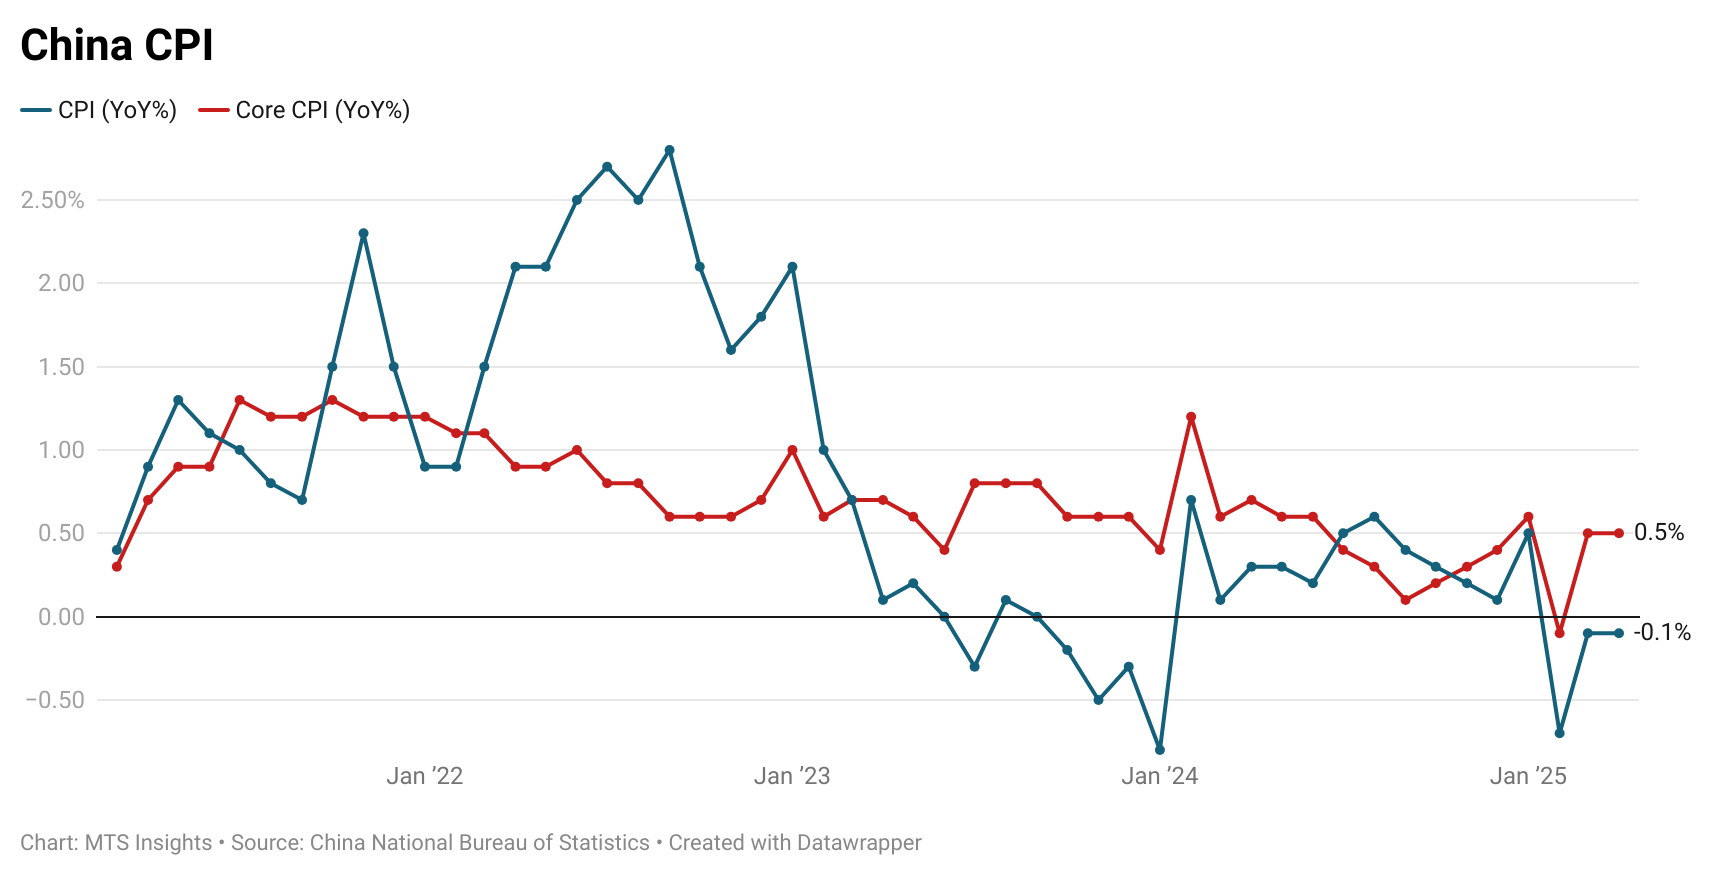
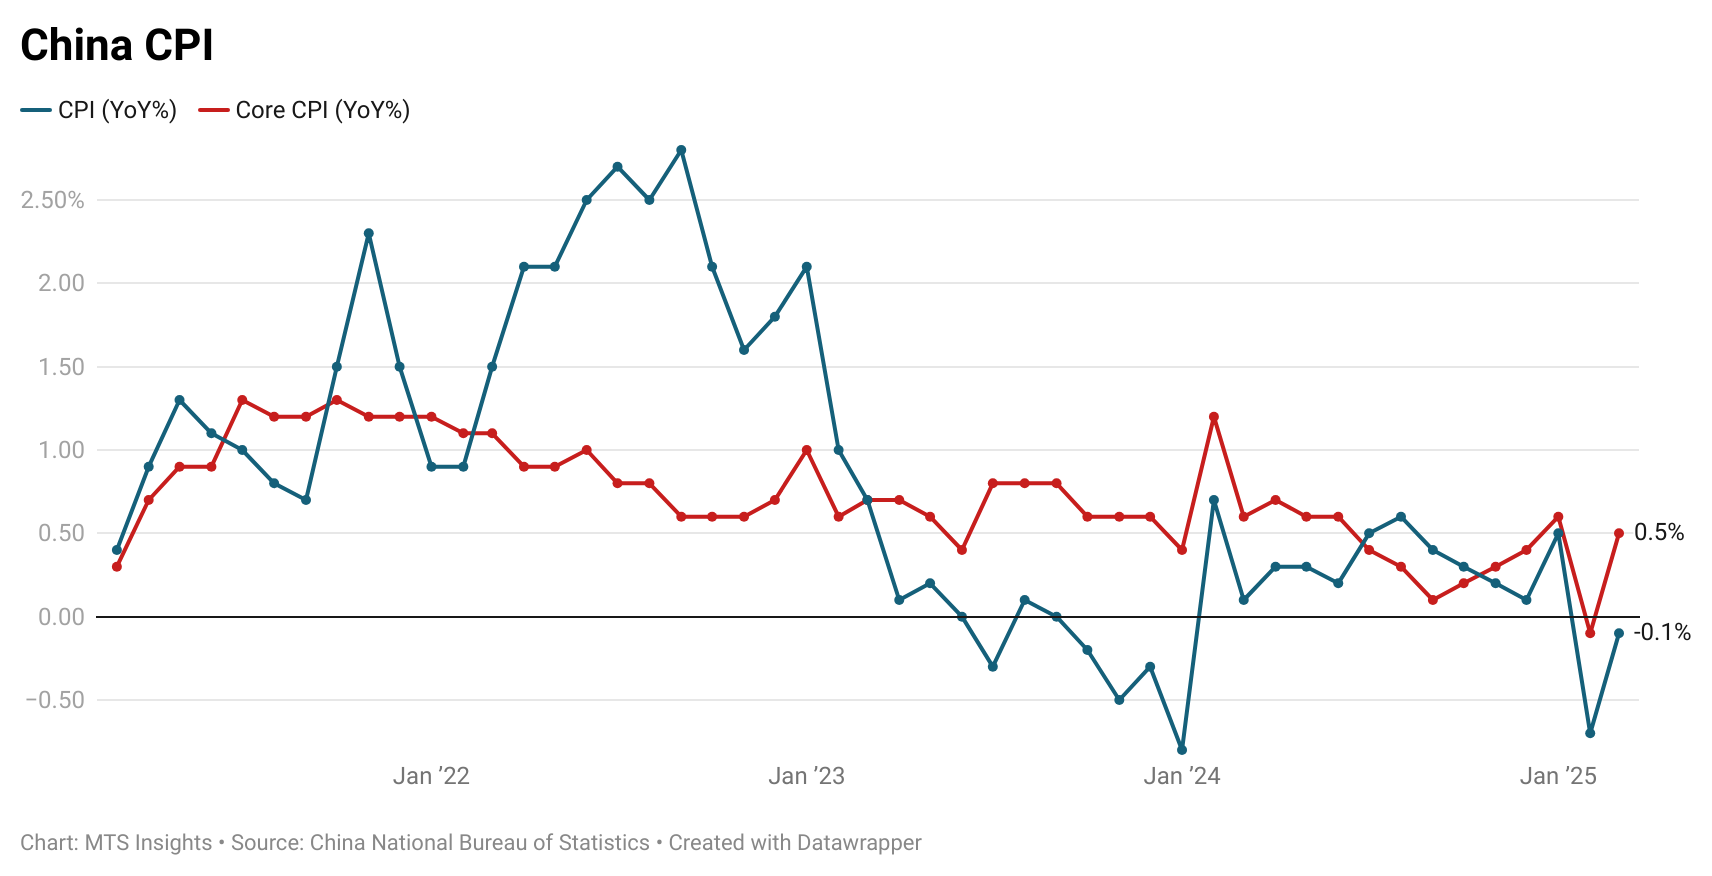
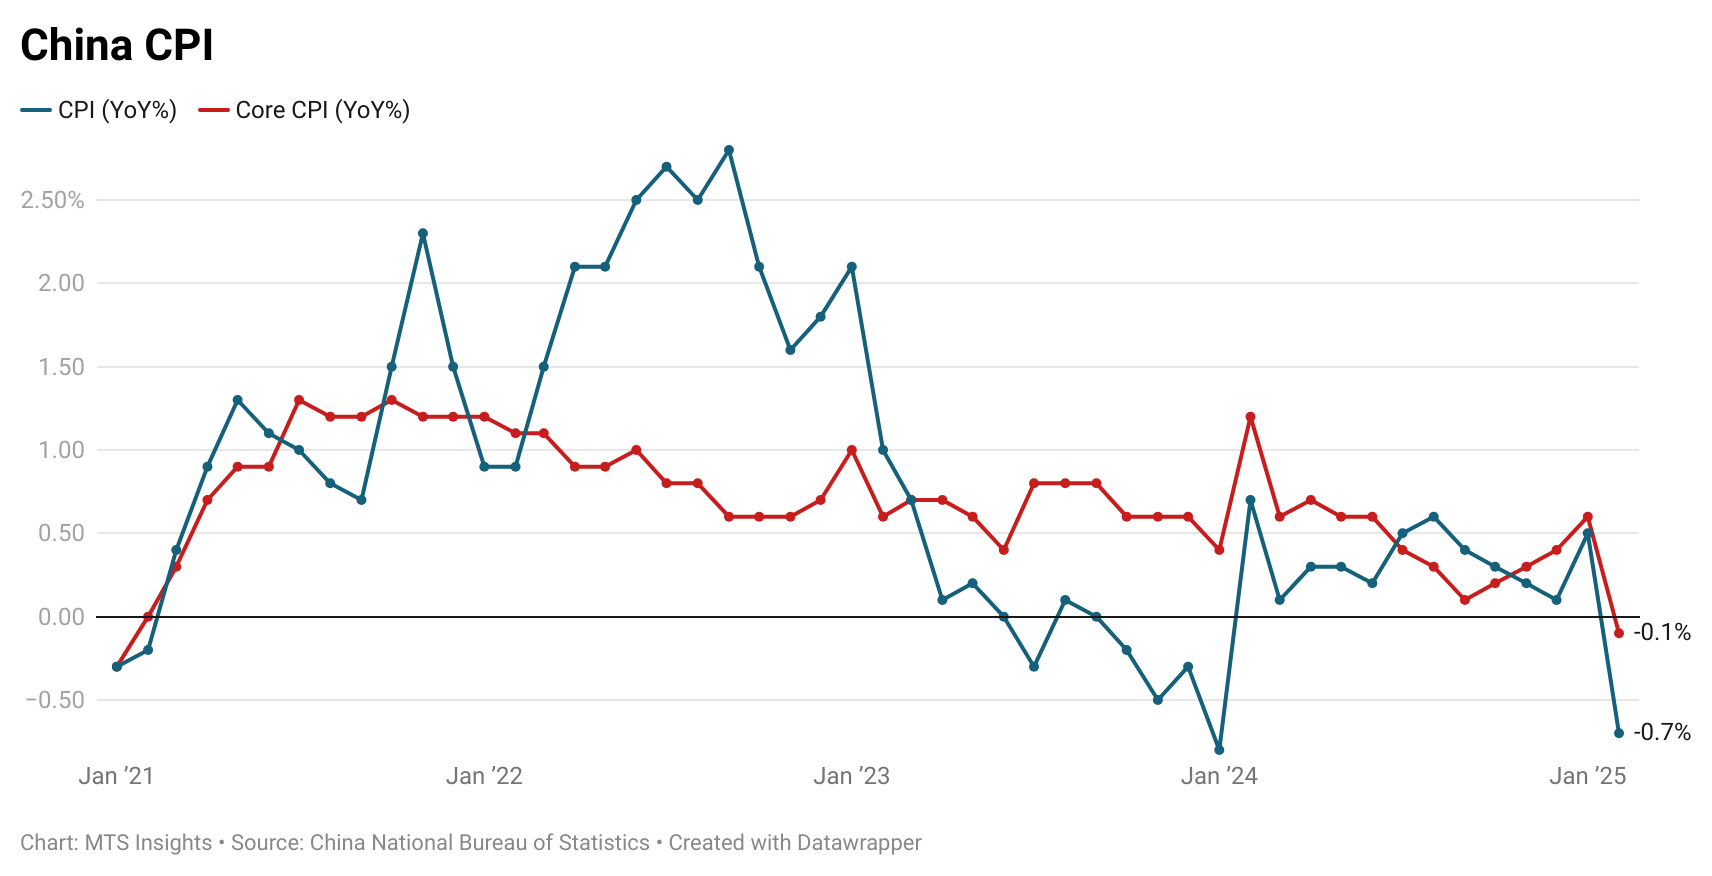
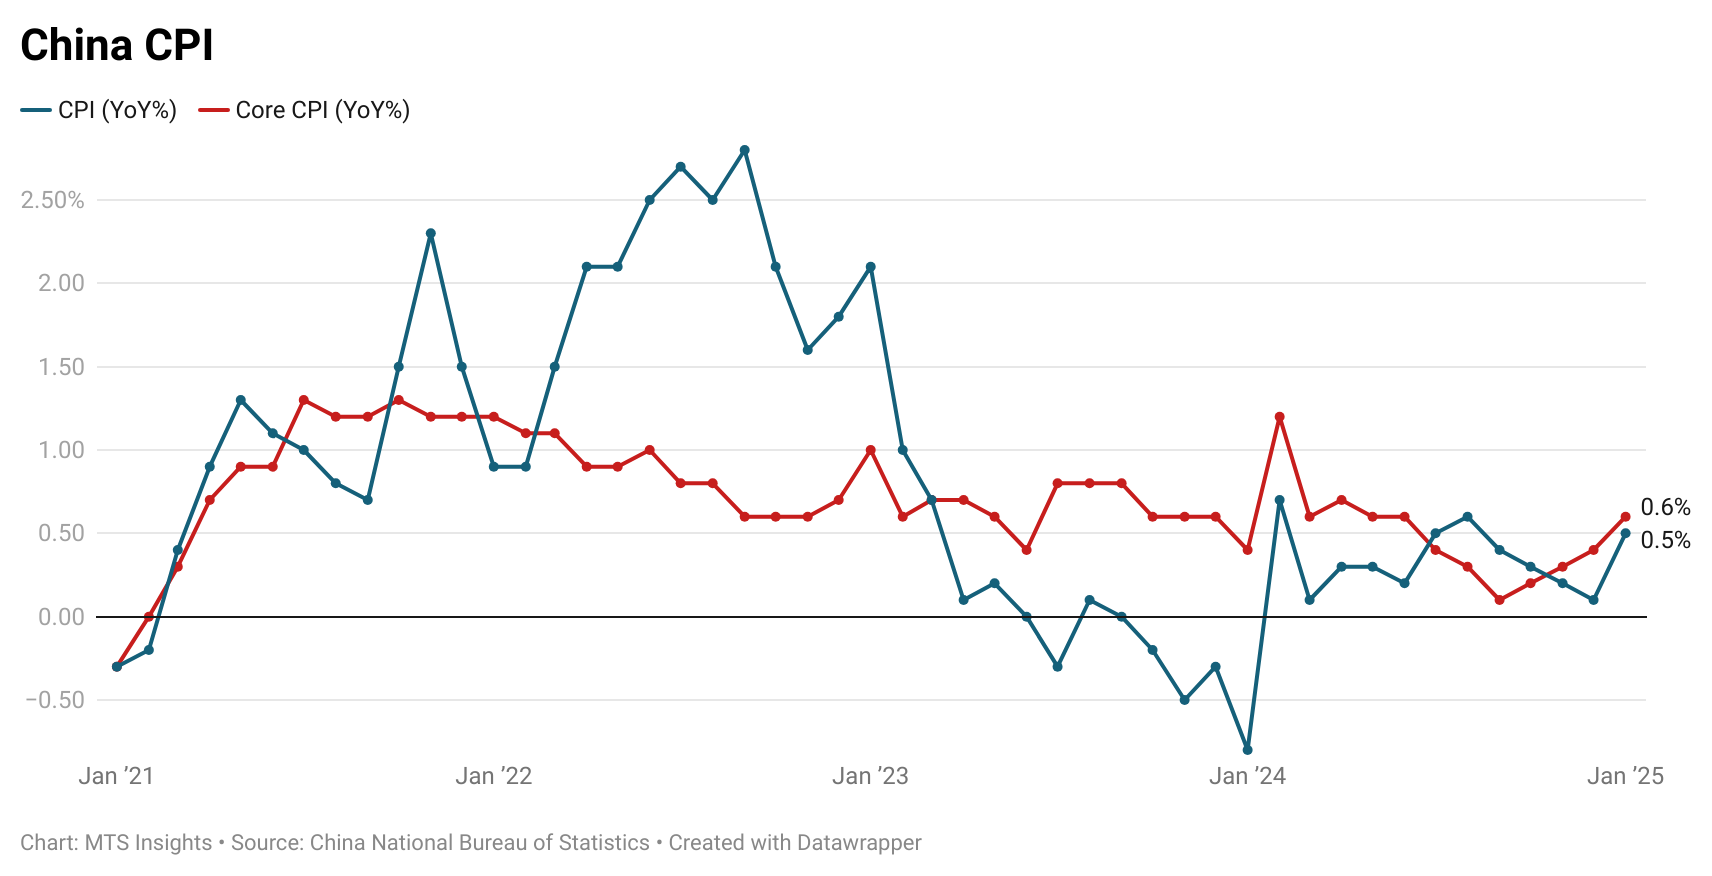
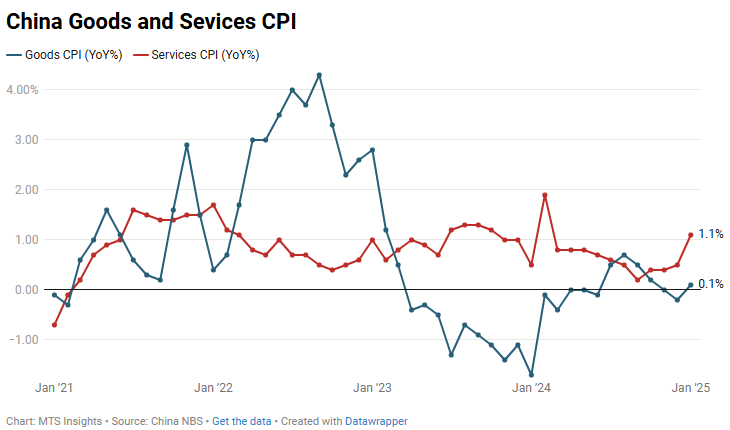
China’s CPI was flat MoM (vs 0.1% MoM expected) and fell -0.4% YoY in August 2025, down from 0.0% YoY in July, reflecting continued food price weakness offset by modest non-food gains.
- Core CPI (ex food and energy) was also flat MoM and rose 0.9% YoY, ticking up from 0.8% YoY in July.
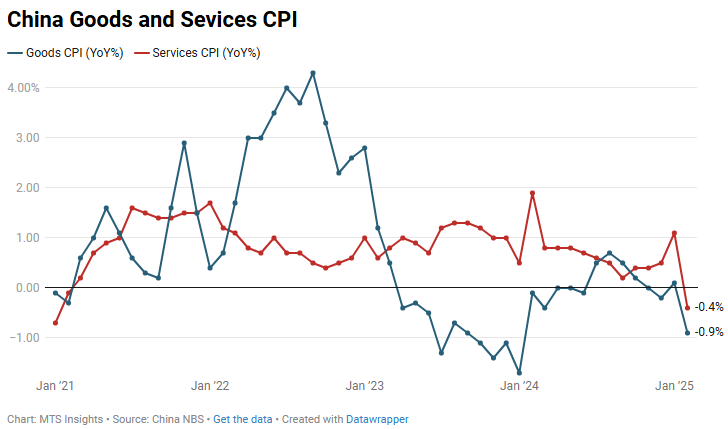
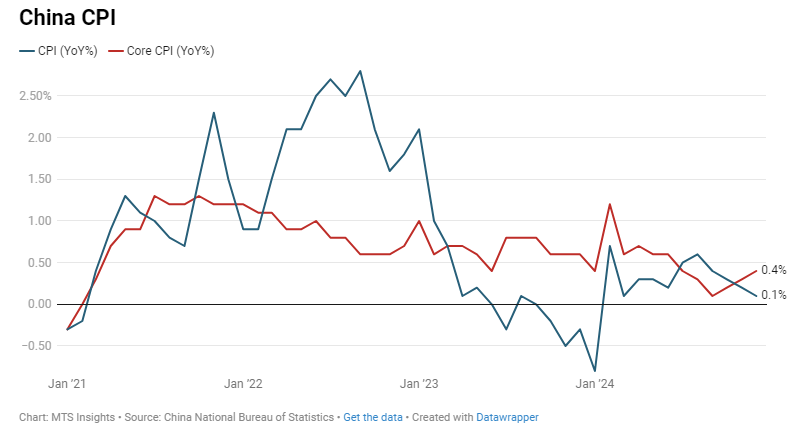
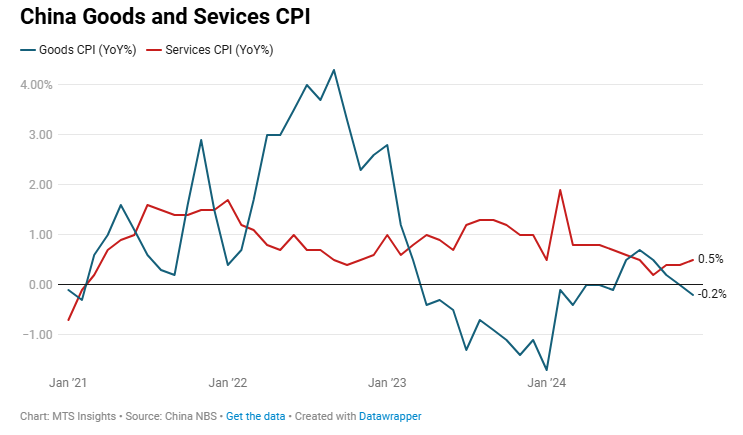
- Food prices dropped -4.3% YoY, led by fresh vegetables (-15.2% YoY), pork (-16.1% YoY), and eggs (-12.4% YoY); aquatic products were one of the only positive segments, up +2.2% YoY.
- Non-food prices rose +0.5% YoY, with increases in clothing (+1.8% YoY), daily necessities and services (+1.8% YoY), and other supplies and services (+8.6% YoY).
- Service prices gained +0.6% YoY, supported by medical services (+1.6% YoY) and education/culture/entertainment (+1.0% YoY).
- Transportation and communication prices fell -2.4% YoY, with fuel down -7.1% YoY.
- On a MoM basis, food rose +0.5%, driven by fresh vegetables (+8.5% MoM) and eggs (+1.5% MoM), while fresh fruit (-2.8% MoM) and aquatic products (-0.9% MoM) fell.
- Non-food edged down -0.1% MoM, as healthcare rose (+0.3% MoM) but transportation and communication declined (-0.3% MoM).
- For Jan–Aug 2025, average CPI declined -0.1% YoY, with food down -1.4% and non-food up +0.2%.